Sequence comparisons
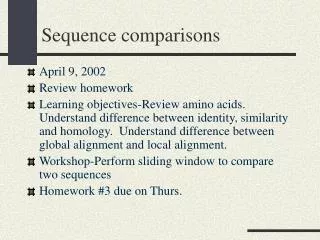
Sequence comparisons. April 9, 2002 Review homework Learning objectives-Review amino acids. Understand difference between identity, similarity and homology. Understand difference between global alignment and local alignment. Workshop-Perform sliding window to compare two sequences

Sequence comparisons
E N D
Presentation Transcript
Sequence comparisons • April 9, 2002 • Review homework • Learning objectives-Review amino acids. Understand difference between identity, similarity and homology. Understand difference between global alignment and local alignment. • Workshop-Perform sliding window to compare two sequences • Homework #3 due on Thurs.
Review of amino acid characteristics http://info.bio.cmu.edu/Courses/BiochemMols/AAViewer/AAVFrameset.htm http://info.bio.cmu.edu/Courses/BiochemMols/BCMolecules.html
Purpose of finding differences and similarities of amino acids. • Infer structural information • Infer functional information • Infer evolutionary relationships
Evolutionary Basis of Sequence Alignment • Similarity: Quantity that relates how much • two amino acid sequences are alike. • 2. Identity: Quantity that describes how much • two sequences are alike in the strictest terms. • 3. Homology: a conclusion drawn from data • suggesting that two genes share a common • evolutionary history.
Evolutionary Basis of Sequence Alignment (Cont. 1) 1. Example: Shown on the next page is a pairwise alignment of two proteins. One is mouse trypsin and the other is crayfish trypsin. They are homologous proteins. The sequences share 41% identity. 2. Underlined residues are identical. Asterisks and diamond represent those residues that participate in catalysis. Five gaps are placed to optimize the alignment.
Evolutionary Basis of Sequence Alignment (Cont. 2) Why are there regions of identity? 1) Conserved function-residues participate in reaction. 2) Structural (For example, conserved cysteine residues that form a disulfide linkage) 3) Historical-Residues that are conserved solely due to a common ancestor gene.
Evolutionary Basis of Sequence Alignment (Cont. 3) Note: it is possible that two proteins share a high degree of similarity but have two different functions. For example, human gamma-crystallin is a lens protein that has no known enzymatic activity. It shares a high percentage of identity with E. coli quinone oxidoreductase. These proteins likely had a common ancestor but their functions diverged. Analogous to railroad car and diner function.
Modular nature of proteins • The previous alignment was global. However, many proteins do not display global patterns of similarity. Instead, they possess local regions of similarity. • Proteins can be thought of as assemblies of modular domains. It is thought that this may, in some cases, be due to a process known as exon shuffling.
Modular nature of proteins (cont. 1) Exon 1a Exon 2a Gene A Duplication of Exon 2a Exon 1a Gene A Exon 2a Exon 2a Exchange with Gene B Exon 1b Gene B Exon 2b Exon 2b Exon 3 (Exon 2b from Gene B) Exon 2a Exon 1a Gene A Exon 1b Exon 3 (Exon 2a from Gene A) Gene B Exon 2b
A T G C C T A G * * A T G C C T A G * * * * * * * * * * * * * * Dot Plots Window = 1 Note that 25% of the table will be filled due to random chance. 1 in 4 chance at each position
Dot Plots with window = 2 A T G C C T A G Window = 2 The larger the window the more noise can be filtered What is the percent chance that you will receive a match randomly? 1/16 * 100 = 6.25% * A T G C C T A G { * { * { * { * { * { * {
Similarity It is easy to score if an amino acid is identical to another (the score is 1 if identical and 0 if not). However, it is not easy to give a score for amino acids that are somewhat similar. CO2- CO2- +NH3 +NH3 Isoleucine Leucine Should they get a 0 (non-identical) or a 1 (identical) or Something in between?
Identity Matrix A 1 C 0 1 I 0 0 1 L 0 0 0 1 A C I L Simplest type of scoring matrix
The Point-Accepted-Mutation (PAM) model of evolution and the PAM scoring matrix It implies that each amino acid (AA) mutates independently of each other with a probability which depends only on the AA. Since there are 20 AA, the transition probabilities are described by a 20X20-mutation matrix, denoted by M. A standard M, which defines a 1-PAM change. Point Accepted Mutation (PAM) Distance: A 1-PAM unit changes 1% of the amino acids on average: where fi is the frequency of AA i. One PAM is a unit of evolutionary divergence in which 1% of the amino acids have been changed.
The Point-Accepted-Mutation (PAM) model of evolution and the PAM scoring matrix (cont. 1) A 2-PAM unit is equivalent to two 1-PAM unit evolution (or M2). A k-PAM unit is equivalent to k 1-PAM unit evolution (or Mk). Example 1: CNGTTDQVDKIVKILNEGQIASTDVVEVVVSPPYVFLPVVKSQLRPEIQV |||||||||||||| ||||||||||||||||||||||||||||||||||| CNGTTDQVDKIVKIRNEGQIASTDVVEVVVSPPYVFLPVVKSQLRPEIQV lengths = 50 1 Mismatch PAM distance = 2
Two proteins that are similar in certain regions Tissue plasminogen activator (PLAT) Coagulation factor 12 (F12).
The Dotter Program • Program consists of three components: • Sliding window • A table that gives a score for each amino acid match • A graph that converts the score to a dot of certain density. • The higher the density the higher the score.
Single region on F12 is similar to two regions on PLAT Region of similarity