Download
1 / 29
290 likes | 375 Vues
Explore the cutting-edge capabilities of the UrbanSim Center at University of Washington, focusing on bridging urban simulation with policy analysis. Learn how UrbanSim's integrated microsimulation framework enhances decision-making in real estate, labor, and transportation dynamics. Discover the center's advanced modeling strategies, such as disaggregating land use models and implementing activity-based travel models for precise urban planning and policy evaluation.

E N D
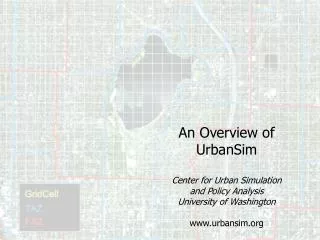
An Overview of UrbanSimCenter for Urban Simulationand Policy AnalysisUniversity of Washingtonwww.urbansim.org
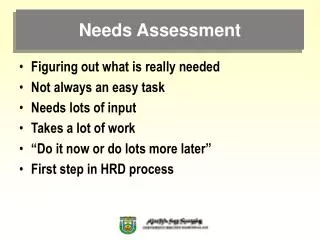
Results of Needs Assessment (in order) • Analyze Effects of Land Use on Transportation • Analyze Multimodal Assignments • Promote Common Use of Data • Manage Data Needs • Analyze All Modes of Travel • Analyze Effects of Land Use Policies • Support Visualization Techniques • Analyze Effects of Transportation Pricing Policies • Analyze Effects of Growth Management Policies • Analyze Effects of Transportation on Land Use
Model real estate, labor and transportation demand and supply market interactions in an integrated microsimulation framework. Eliminate artificial separation of household choices Represent processes at appropriate temporal and spatial detail Real estate and labor markets: annual, parcel Activityand travel: mid-term model effort: 5 daily periods, parcel / long-term: continuous time Integrate and extend recent advances in operational models Disaggregate land use models (Eugene, Honolulu, Salt Lake City) Activity based travel models (San Francisco, Portland) Implement as a distributed model system for use by PSRC, cities and counties, state agencies, public with a web-based user-interface Implementation plan balancing needs, costs, schedule, and risks Recommendations for New Model Design (made in 2001)
Linked Urban Markets Services Governments Infrastructure Land Housing Developers Floorspace Households Labor Businesses Flow of consumption from supplier to consumer Regulation or Pricing
Long-term Modeling Strategy:Integrated Model of Markets for Real Estate, Labor and Transportation Households Governments Businesses Demographic Processes • Ageing • Household structure • Migration Land Use Regulation • Land use plans • Growth management Transportation • Infrastructure • Pricing Economic Processes • Economic structure • Output goods/services • Inter-regional trade Long-term Choices • Residential Mobility • Housing Choice • Labor Supply • Workplace Choice • Vehicle Ownership Long-term Choices • Mobility • Location Choice • Labor Demand Developers Real Estate Processes • Land development • Housing development • Non-res development • Redevelopment Short-term Choices • Activity Generation • Activity Scheduling • Allocation of Vehicles • Activity Location Short-term Choices • Goods movement
An Illustration of the Approach • Consider a major decrease in transport costs • In reality, a household could substitute among any combination of interdependent changes: • Change travel routes, modes, times to take advantage • Make more trips • Make longer trips to other destinations • Move residence to buy more space or amenities farther out • Change jobs or enter job market • Add a household vehicle • The proposed model would recognize these as interdependent choices, whereas current models would not
Phased Model Improvements: 2002-5 • Implement Land Use Model based on UrbanSim (current specification) • Phase I: Develop database • Phase II: Estimate model paramaters • Phase III: Test and validate model system • Integrate with current PSRC models: • STEP macroeconomic model • Travel model system
UrbanSim Design Objectives • Support coordinated land use, transportation, and environmental planning and modeling • Use a transparent behavioral framework • Represent interactions of markets and policies • Represent sufficient detail to support: • Municipal applications; corridor studies • Non-motorized transport policies and TOD • Environmental and land use policies • Support trade-off analysis among objectives • Efficiency • Equity • Environmental Impact • Develop an Open Source modeling platform
UrbanSim Model Design • Discrete Choice Framework • Household Relocation and Location Choice • Business Relocation and Location Choice • Real Estate Development • Explicit Markets for Real Estate • Governmental policies exogenous: scenarios • Dynamic • Path-dependent (history matters) • Supply fixed in short run (one year) • Adjustment toward equilibrium in long-run • Annual time steps
How is UrbanSim Different? • Dynamic, non-equilibrium approach • Spatial detail very high • Behavioral approach empirically measures responses to policies • Focuses visioning on goals and objectives • Links visioning to planning and evaluation
Grid Cell GRID_ID COMMERCIAL_SQFT GOVERNMENTAL_SQFT INDUSTRIAL_SQFT COMMERCIAL_IMPROVEMENT_VALUE INDUSTRIAL_IMPROVEMENT_VALUE GOVERNMENTAL_IMPROVEMENT_VALUE NONRESIDENTIAL_LAND_VALUE RESIDENTIAL_LAND_VALUE RESIDENTIAL_IMPROVEMENT_VALUE RESIDENTIAL_UNITS YEAR_BUILT FRACTION_RESIDENTIAL_LAND PERCENT_UNDEVELOPABLE TOTAL_NONRES_SQFT DEVELOPMENT_TYPE_ID DISTANCE_TO_ARTERIAL DISTANCE_TO_HIGHWAY RELATIVE_X RELATIVE_Y Household HOUSEHOLD_ID GRID_ID PERSONS WORKERS AGE_OF_HEAD INCOME CHILDREN RACE_ID CARS PLAN_TYPE_ID PERCENT_WATER PERCENT_WETLAND PERCENT_STREAM_BUFFER PERCENT_FLOODPLAIN PERCENT_SLOPE PERCENT_OPEN_SPACE PERCENT_PUBLIC_SPACE PERCENT_ROADS IS_OUTSIDE_URBAN_ GROWTH_BOUNDARY IS_INSIDE_NATIONAL_FOREST IS_INSIDE_TRIBAL_LAND IS_INSIDE_MILITARY_BASE ZONE_ID CITY_ID COUNTY_ID PERCENT_AGRICULTURAL_ PROTECTED_LANDS ACRES Job JOB_ID GRID_ID SECTOR_ID HOME_BASED SIC
Key Model Components • Household and Employment Location • Standard multinomial logit • Grid cell is unit of choice • Real Estate Development • Multinomial logit • 24 development type outcomes • Real Estate Price Estimation • Hedonic regression
Data Inputs • Regional Control Totals • Parcel Data • Business Establishments • Household Data (Census, Travel Survey) • Land Use Plan/Zoning • Environmental Features • Public Land ownership
Residential Location Variables • Housing Characteristics • Prices (interacted with income) • Development types (density, land use mix) • Housing age • Regional accessibility • Job accessibility by auto-ownership group • Travel time to CBD and airport • Urban design-scale (local accessibility) • Neighborhood land use mix and density • Neighborhood employment
Employment Location Variables • Real Estate Characteristics • Prices • Development type (land use mix, density) • Regional accessibility • Access to population • Travel time to CBD, airport • Urban design-scale • Proximity to highway, arterials • Local agglomeration economies within & between sectors: center formation
Development Variables • Site characteristics • Existing development characteristics • Land use plan • Environmental constraints • Urban design-scale • Proximity to highway and arterials • Proximity to existing development • Neighborhood land use mix and property values • Recent development in neighborhood • Regional • Access to population and employment • Travel time to CBD, airport
Land Price Variables • Site characteristics • Development type • Land use plan • Environmental constraints • Regional accessibility • Access to population and employment • Urban design-scale • Land use mix and density • Proximity to highways and arterials
UrbanSim – Travel Model Interactions Households by Income Age of head Size Workers Children Employment by sector Travel Models UrbanSim Composite Utility by Auto Ownership Highway Travel Times Vehicle Ownership Probabilities
Creating Policy Scenarios • Macroeconomic Assumptions • Household and employment control totals • Development constraints • Can select any combination of • Political and planning overlays • Environmental overlays • Land use plan designation • Constraints determine which development types cannot be built • Transportation infrastructure • User-specified events
Puget Sound Regional Council 4 Counties 72 Cities 3 Ports WS Dept of Transp WS Transp Comm also: 6 transit agencies 6 Associate Members 2 adjacent counties 2 tribes 1 port Evans School of Public Affairs, UW SNOHOMISH Everett Bellevue KING Bremerton Seattle KITSAP Tacoma PIERCE
Puget Sound Regional Council Population: 3,275,847 Area: 6,287.8 sq mi SNOHOMISH Everett Bellevue KING Bremerton Seattle KITSAP Tacoma PIERCE
Puget Sound Regional Council Population: 3,275,847 Area: 6,287.8 sq mi SNOHOMISH Everett Urban Growth Area Population: 2,804,125 Area: 980.1 sq mi Bellevue KING Bremerton Seattle KITSAP Tacoma PIERCE
Major Steps in Data Preparation • Determine study area boundary • Generate grid over study area • Assemble and standardize parcel data • Impute missing data on parcels • Assemble employment data • Assign employment to parcels • Convert Parcel data to grid • Convert other GIS layers to grid • Assign Development Types • Synthesize household database • Diagnose data quality and make refinements • Document data and process