Download
1 / 24
240 likes | 258 Vues
This study examines the prevalence of diabetes in Ontario based on income level. It reveals higher rates of diabetes among low-income residents compared to those with higher incomes. The study also identifies critical periods in life that may influence diabetes risk. Additionally, it provides ten tips for better health and highlights the need to address lifestyle choices within broader social contexts. The report includes mortality data and rankings in comparison to other industrialized nations. It concludes with a critical analysis of reasons for resistance to addressing health disparities based on income.

E N D
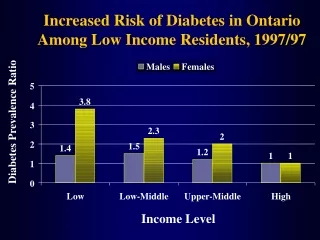
Increased Risk of Diabetes in Ontario Among Low Income Residents, 1997/97 Males Females 5 3.8 4 Diabetes Prevalence Ratio 3 2.3 2 2 1.5 1.4 1.2 1 1 1 0 Low Low-Middle Upper-Middle High Income Level
Diabetes Prevalence in Ontario by Neighbourhood Income Quintile, 1999 9 7.76 8 7.05 6.78 7 5.76 6 5.12 Diabetes Prevalence Rate 5 4 3 2 1 0 Q1 (Lowest) Q2 Q3 (Middle) Q4 Q5 (Highest) Neighbourhoood Classified by Mean Income
Diabetes, Males ASMRx 100,000
Diabetes, Females ASMRx 100,000
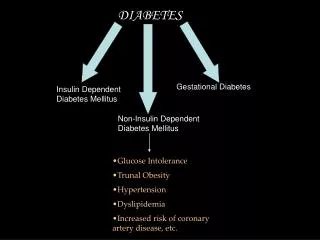
Critical Periods of the Life Course • Foetal development • Birth • Nutrition, growth and health in adulthood • Educational Career • Leaving parental home • Entering labour market • Establishing social and sexual relationships • Job loss or insecurity • Parenthood • Episodes of illness • Labour market exit • Chronic sickness • Loss of full independence -- Shaw et al., The Widening Gap, 1999, p. 106.
Ten Tips For Better Health - Donaldson, 1999 1. Don't smoke. If you can, stop. If you can't, cut down. 2. Follow a balanced diet with plenty of fruit and vegetables. 3. Keep physically active. 4. Manage stress by, for example, talking things through and making time to relax. 5. If you drink alcohol, do so in moderation. 6. Cover up in the sun, and protect children from sunburn. 7. Practise safer sex. 8. Take up cancer screening opportunities. 9. Be safe on the roads: follow the Highway Code. 10. Learn the First Aid ABC : airways, breathing, circulation.
Ten Tips for Staying Healthy - Dave Gordon, 1999. 1. Don't be poor. If you can, stop. If you can't, try not to be poor for long. 2. Don't have poor parents. 3. Own a car. 4. Don't work in a stressful, low paid manual job. 5. Don't live in damp, low quality housing. 6. Be able to afford to go on a foreign holiday and sunbathe. 7. Practice not losing your job and don't become unemployed. 8. Take up all benefits you are entitled to, if you are unemployed, retired or sick or disabled. 9. Don't live next to a busy major road or near a polluting factory. 10. Learn how to fill in the complex housing benefit/ asylum application forms before you become homeless and destitute.
Avoiding the Life-Style Trap • Lifestyle choices are heavily structured by life circumstances • Lifestyle choices by themselves account for modest proportions of health status • Lifestyle choices are difficult to change without considering life contexts • Lifestyle choice emphases can have unintended side-effects that work against health
Political economy is a study of the natural laws governing the production and distribution of wealth.
Working-Aged Male (25-64) Mortality by Median Share U.S. States and Canadian Provinces U.S. States with weighted linear fit (from Kaplan et al., 1996) 800 Canadian Provinces with weighted linear fit (slope not significant) MS LA 675 SC AL Rate per 100,000 Population FL 550 TX CA ME PEI QUE 425 NH NS NB NFLD MAN MN ONT BC ALTA SASK Mortality Rates Standardized to the Canadian Population in 1991 300 0.18 0.20 0.22 0.24 Median Share of Income
FlorenceSC SiouxCityIA Prince George MonroeLA TuscaloosaAL JacksonvilleNC ChicagoIL WashingtonDC Shawinigan Barrie Oshawa Working Age (25-64) Mortality by Median Share U.S. and Canadian Metropolitan Areas U.S. cities (n=282) with weighted linear fit (from Lynch et al. 1998) 600 Canadian cities with weighted linear fit (n=53) (slope not significant) FlorenceSC NewOrleansLA AugustaGA PineBluffAR 500 NewYorkNY Rate per 100,000 Population MonroeLA 400 LosAngelesCA BryanTX SiouxCityIA PortsmouthNH 300 McallenTX Montreal Vancouver AppletonWI Toronto Mortality Rates Standardized to the Canadian Popluation in 1991 200 0.19 0.23 0.15 0.27 Median Share of Income Oshawa
USA, Canada, and Sweden Rankings on Compared to Other Industrialized Nations (Ranking, 1 is best) Measure USA Canada Sweden Income Inequality (1990) 18 of 18 11 3 Child Poverty (1990) 17 of 17 14 2 Infant Mortality (1996) 24 of 29 17 2 Youth Suicide (1992-1995 15 of 22 16 10 High School Drop-Outs (1996) 17 of 17 16 10 Youth Homicide (1992-1995 ) 22 of 22 19 5 Wages (1996) 13 of 23 15 6 Unemployment (1996) 2 of 10 7 8 Elderly Poverty (1990) 15 of 17 4 5 Life Expectancy (1996) 20 of 29 4 3
Canadian Policy Directions It has become obvious that people on the low end of the income scale are cut off from the ongoing economic growth that most Canadians are enjoying. It is also obvious that in these times of economic prosperity and government surpluses that most governments are not yet prepared to address these problems seriously, nor are they prepared to ensure a reasonable level of support for low-income people either inside or outside of the paid labour force. -- Poverty Profile, 1998. Ottawa: National Council of Welfare Reports, Autumn, 2000.
Critical Analysis I: Reasons for Resistance • Lack of Epidemiological Theory Health officials and reporters seem unaware of recent developments in social epidemiological theory and population health research findings. • Commitment to Ideology of Individualism in Health, Illness and Health Promotion Assiststhe neo-liberal and neo-conservative agendas of blaming individuals for their health problems, absolving governments of blame for their health threatening policies that create poverty, inequality, and social exclusion.
Critical Analysis II: Side Effects of the Biomedical and Lifestyle Heart Health Approach • Removes the issue of the social determinants of cardiovascular disease and diabetes right off the public policy agenda. • Low income people made to feel that they are responsible for their own poor health (victim blaming). • Health workers and the media become complicit in the process of ‘poor bashing’: Ignoring facts and repeating stereotypes about people who are poor.
Critical Analysis III: The Holy Trinity As with any area of medical or scientific research, the selection of ‘factors” to be studied cannot be immune from prevailing social values and ideologies. ... It is also evident that so called lifestyle or behavioural factors (such as the holy trinity of risks - diet, smoking and exercise) receive a disproportionate amount of attention. As we have seen, the identification and confirmation of risk factors is often subject to controversy and the evidence about causal links is not unequivocal. Nettleton, S. (1997). Surveillance, Health Promotion and the Formation of a Risk Identity in Debates and Dilemmas in Promoting Health. London UK: MacMillan.
Dennis RaphaelSchool of Health Policy and ManagementYork UniversityToronto, Canada416-736-2100, ext. 22134draphael@yorku.ca