Download
1 / 7
70 likes | 137 Vues
Learn how to analyze the graph of a function by examining domain restrictions, critical points, and concavity for accurate sketching using derivatives.

E N D
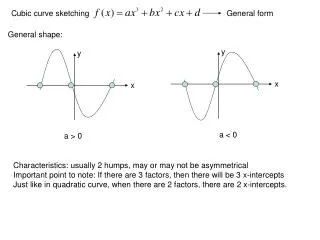
Curve Sketching A Summary
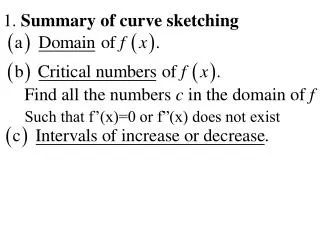
What Steps Do I Take to Analyze the Graph of a Function The equation of a function is given. • begin by looking at any restrictions to the domain of the function. Where is the function undefined? This can occur in two places: a) Where is the denominator equal to zero – produces asymptotes. b) For square roots, exclude domain elements which produce negative values. • Take First Derivative. a) set equal to zero and solve for the variable. These solutions provide critical points… domain values where the function has either a local maximum, minimum, or inflection point. Also, remember to include values that make the denominator 0. b) Intervals where 1st derivative > 0, function rises c) Intervals where 1st derivative < 0, function falls • Take Second Derivative. a) Substitute the critical values from 2a into the second derivative and evaluate. - If second derivative of critical value > 0, it is a local minimum - If second derivative of critical value < 0, it is a local maximum - If second derivative of critical value = 0, it is an inflection point.
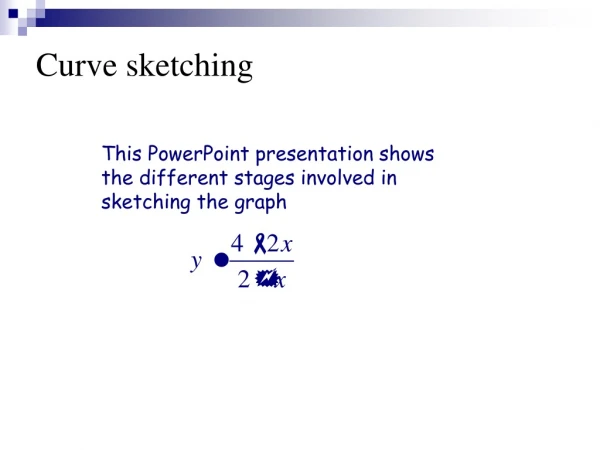
Final use for second derivative. a) Intervals over which second derivative is positive is where the graph is concave up. b) Intervals over which second derivative is negative is where the graph is concave down. Suggestion: Use a Chart Let’s analyze a function and put this all together. Sketch the curve of the function STEP 1 – Function is defined everywhere! No denominators or square roots.
Conclusion: critical values at x = -3 and x = 1. Second derivative will reveal weather maximum, minimum, or inflection points. Use first derivative to investigate the 3 regions: x < -3, -3 < x < 1, x >1 whether function rises/falls. Use second derivative to investigate where function is concave up or concave down. STEP 2 – Take first derivative: find critical values and regions where function rises and falls. 0 = 6x + 6 -6 = 6x -1 = x