Download
1 / 18
180 likes | 193 Vues
Learn about the legal challenges and overall impact of the EPA's Clean Power Plan, including its potential unconstitutional aspects and effects on states, Congress, and the energy industry.

E N D
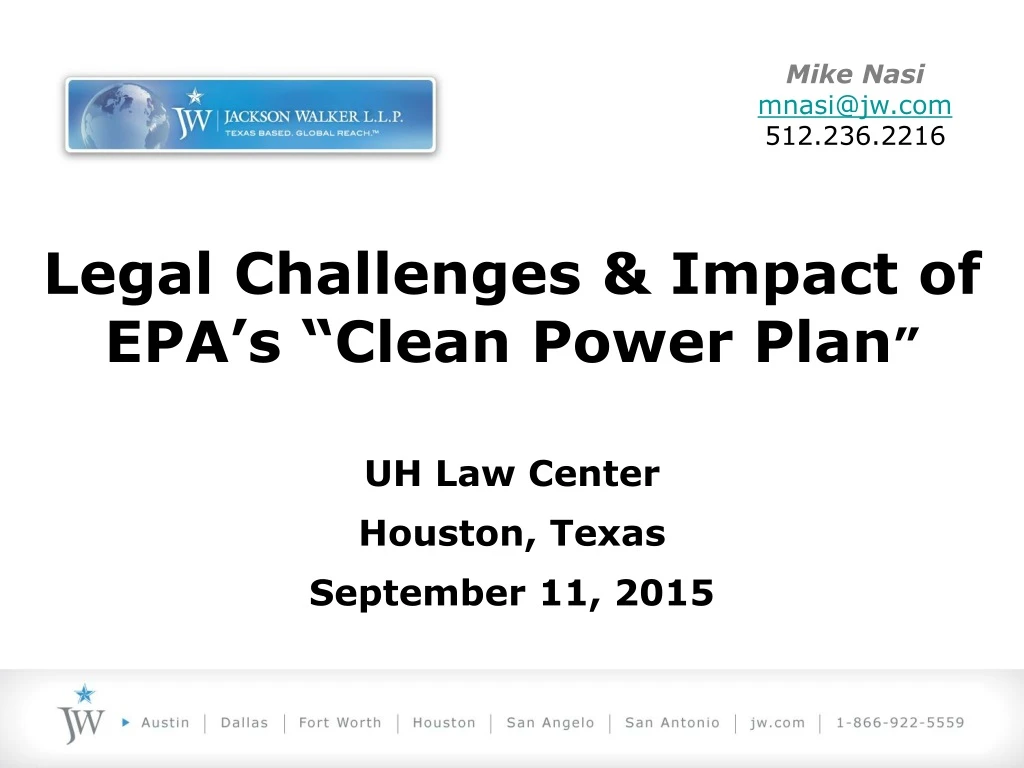
Mike Nasi mnasi@jw.com 512.236.2216 Legal Challenges & Impact of EPA’s “Clean Power Plan” UH Law Center Houston, Texas September 11, 2015
“EPA is attempting an unconstitutional trifecta: usurping the prerogatives of the States, Congress and the Federal Courts – all at once. Burning the Constitution should not become part of our national energy policy.” • Congressional Testimony Regarding EPA’s Clean Power Plan - Laurence Tribe, Harvard Law professor, long-time mentor, counselor and supporter of President Obama, Testimony against EPA’s Clean Power Plan
1 How the BSER ‘Building Blocks’ Work(Proposed versus Final) (animated) Example: Texas Emission Rate (lb CO2/MWh) 1,566 New Baseline 1,292(too low to begin with due to use of 2012 baseline data) 2012 Texas Baseline -4% from assumed improvements in efficiency at coal plants of 6% Block 1 Heat rate improvements 49 -20% from increasing CCGT utilization to 70% (from 45% in Texas 2012); shifts 72 million MWh from coal to gas1 Block 2 Re-dispatch of fleet 258 -10% from EPA-derived renewable target of 20% + keep “at risk” nuclear capacity Block 3 More renewables, nuc. 124 -5% from reducing end-user consumption by 1.5% annually Block 4 Demand-side reduction 70 TX BSER = 237 (fossil steam) & 697 (NGCC) 2030 Texas Target 791 by 2030 (38.4% Reduction) Default BSER=1,305 (fossil steam) & 771 (NGCC) MWh of Generation of each Final Texas Budgeted Rate=1,042 (1,188 by 2022) (33.5% Reduction off of baseline) Source: IHS CERA: “Digesting EPA’s Proposed Clean Power Plan”; June 10, 2014 Webcast; Final Clean Power Plan, EPA “State at a Glance” Document, Texas.
Texas Budget Computation & Retirements RATE GOAL – Baseline 1,566 lbs/Net MWh MASS TARGET – Baseline 240,730,037 (Short tons) Total retirement of 1786 MW; approximately 893,000 homes. Sources: Clean Power Plan State Goal Visualizer; retirement data from Clean Power Plan and IMP v.5.15; ERCOT “mild spring day” demand condition estimate of 1 MW per 500 homes.
Comparison of Reductions – Proposal to Final RATE Application to Baseline Emissions (Tons) Sources: Proposal – eGRID Methodology TSD, Goal Computation TSD; Final – Emission Performance Rate and Goal Computation, Goal Computation Appendix 1, EPA “State at a Glance” Documents.
Comparison of Reductions – Proposal to Final MASS Application to Baseline Emissions (Tons) Sources: Proposal – eGRID Methodology TSD, Bloomberg, New Energy Finance Analysis of CPP Proposal (for mass conversion); Final – Emission Performance Rate and Goal Computation, Goal Computation Appendix 1, EPA “State at a Glance” Documents.
States’ Proportion of Total CO2 Reductions Rate Application to Baseline Emissions (Tons) FINAL PROPOSAL Remaining states have reductions in CO2 less than 2% of total U.S. emissions. Does not include Alaska, Hawaii, and Vermont since no final standard in rule. Sources: Final - Emission Performance Rate and Goal Computation, Goal Computation Appendix 1, EPA “State at a Glance” Documents; Proposal - EPA Data File - 2012 Unit-Level Data Using the eGRID Methodology.
Comparison of Raw State CO2 Emission Rates (lbs/MWh) Source: EPA Data File - 2012 Unit-Level Data Using the eGRID Methodology; Includes Vermont, which is not subject to Existing-Source GHG Rule.
Projected Nationwide Incremental Increase in Renewable Generation Onshore Wind Solar Geothermal Concentrating Solar Power Hydropower Historic Maximum Growth “Franken-Fleet” Average Historic Growth Megawatt-Hours of Dispatch EPA assumes the construction of 104,317 MW of wind capacity from 2022-30. This equals 45,000 2.3-MW turbines and over 5.2 million acres; greater than the combined land area of Rhode Island, Delaware, and Connecticut (beyond the 82,000+MW expected to be installed as of 2021 – another 4.1 million acres). Sources: EPA, Greenhouse Gas Mitigation Measures TSD (Final Rule); EPA, GHG Abatement Measures TSD (Rule Proposal). Assumes: 2012 baseline capacity is apportioned, by technology, at EPA’s modeled historic distribution; average acre/MW (5 MW/KM2) from NREL, U.S. Renewable Energy Technical Potentials: A GIS-Based Analysis, July 2012; state areas from U.S. Census, Geography, State Area Measurements; 2012 Projected Installed Wind Capacity from U.S. EIA, Annual Energy Outlook 2015, Table 58.
PUTTING EPA’S ASSUMED WIND & SOLAR BUILD IN PERSPECTIVE (2013-2030 U.S. Build v. Current World) CPP ASSUMES THAT U.S. WILL BUILD & DISPATCH 6 XMORE WIND & SOLAR MWh BEFORE 2030 THAN ANY NATION’S CURRENT WIND/SOLAR FLEET DISPATCHES Million MWh TEXAS ALONE IS ASSUMED TO ADD AS MUCH WIND & SOLAR AS ANY OTHER NATION HAS NOW Applies EPA’s incremental growth targets under the final CPP and assumes EPA’s modeled historic distribution of generation from 2013 through 2021. Sources: EPA Greenhouse Gas Mitigation Measures TSD; EIA, International Energy Statistics, Renewables, 2012.
ERCOT Capacity Factor for Non-Coastal Wind at Peak: 12% EPA Wind Fleet-Wide Assumed Capacity Factor: 41.8% 11
Peak ERCOT Demand & Wind Over Peak (Case Study – First Week of August 2015) ERCOT 2015 installed wind capacity is 13,060 MW. 69,783* 69,625 68,912* 68,693 68,459* 66,602 66,234 66,352 65,690 61,871 60,903 Wind Over Peak: 1,066 MW MW Wind At Peak Idle Installed Wind Remaining Generation *New Peak Records: Aug. 5 – 68,459 (Wind Over Peak 2,501); August 6 – 68,912 (Wind Over Peak 3,418); August 10 – 69,783 (Wind Over Peak 2,242). Sources: ERCOT, Daily Wind Integration Reports; ERCOT, Item 4.1: CEO Update.
Projected Incremental Increases in ERCOT: Dealing with Wind Performance at Peak Add. Wind if 12% Cap. Factor Add. Wind if 34% Cap. Factor Onshore Wind (41.8% EPA Cap. Factor) Solar Geothermal Concentrating Solar Power Hydropower Megawatts Installed Capacity ~46,000 MW gap needing to be filled to cover discrepancy between capacity factors – 12% cap. factor ~4,200 MW gap needing to be filled to cover discrepancy between capacity factors – 34% cap. factor ERCOT Peak Average Capacity Contribution for Non-Coastal Wind is 12%; Peak Average Capacity Contribution for Coastal Wind is 56%. Demonstrated 34% capacity factor is based on average of coastal and non-coastal capacity factors. Sources: EPA, Greenhouse Gas Mitigation Measures TSD; ERCOT Capacity, Demand, and Reserves Report, May 4, 2015.
Climate Benefits of Clean Power Plan • U.S. PAIN – 2012 to 2020: • EPA projected retirements of 121,000 MW of capacity by 2020. • Total spending on electricity increases from $364 to $541 billion per year, a $177 billion (49%) increase. • Total spending on gas increases from $107 to $214 billion per year, a $107 billion (100%) increase. • Residential electric bills increase by 27%. • Residential gas bills increase by 50%. • TEXAS PAIN – 2012 to 2020: • EPA projected retirements of 16,283 MW of capacity by 2020. • Total spending on electricity increases from $31.4 to $60.8 billion per year, a $29.4 billion (93%) increase. • Total spending on gas increases from $7.9 to $20.9 billion per year, a $13.1 billion (166%) increase. • Residential electric bills increase by 48%. • Residential gas bills increase by 75%. Reduction from Rule Based on EPA Methodology – 0.01° F IPCC Projected Increase in Global Avg. Temp. – Up to 3.6° F 60° Current Global Avg. Temp. – 58.24° F Modeled CO2 Reduction 0.98 ppm 50° 40° 30° 20° 10° 0° • WORLD GAIN: • 0.2% reduction in CO2 concentration (see pie chart). • Global temperature increase reduced by 0.01F. • Sea level rise reduced by less than 1/100thof an inch (less than the thickness of 2 sheets of paper or 1 or 2 human hairs. • In 2025, total annual US reductions will be offset by approximately 3 weeks of Chinese emissions. Remaining CO2 Concentration 499.02 ppm GLOBAL CO2 CONCENTRATION * “Pain” statistics are based on the proposal’s 30% nationwide reduction. The final rule requires a 32% nationwide reduction. Additional studies forthcoming.
Climate Benefits of Clean Power Plan -SOURCES- • “PAIN” SOURCES: • EPA, IPM, Proposed Clean Power Plan, Base Case. • EPA, IPM, Proposed Clean Power Plan, Option 1. • Energy Ventures Analysis, Energy Market Impacts of Recent Federal Regulations on the Electric Power Sector, November 2014. The study incorporates environmental policies that were enacted as of August 2013; the same assumption made by EPA. Projected cost increases do not include other non-power market forces on the price of gas, such as increases in exports, transportation use, or industrial use. • “GAIN” SOURCES: • U.S. EPA, Regulatory Impact Analysis: Final Rulemaking for 2017-2025 Light-Duty Vehicle Greenhouse Gas Emission Standards and Corporate Average Fuel Economy Standards, August 2012. Provides basis of EPA’s assessments of climate impacts of CO2 reductions. • EPA Analysis of the Clean Power Plan, IPM Run Files, EPA Base Case for the Clean Power Plan, Base Case State Emissions spreadsheet; Rate-Based, Rate-Based State Emissions spreadsheet; and Mass-Based, Mass-Based State Emissions spreadsheet. • National Oceanic and Atmospheric Administration, Earth System Research Laboratory, “Recent Monthly Average Mauna Loa CO2.” • IPCC, Climate Change 2013: The Physical Science Basis: Contribution of Working Group I to the Fifth Assessment Report of the Intergovernmental Panel on Climate Change, Chapters 1 & 12. Intergovernmental Panel on Climate Change (IPCC) projected concentrations of CO2 in 2050 from 450 to 600 ppm. • Statement of Karen Harbert, U.S. Chamber of Commerce, U.S. House of Representatives Comm. on Science, Space, & Technology, April 15, 2015. • National Centers for Environmental Information, NOAA, Global Analysis – Annual 2014.
Path Forward(and projected timing) • October/November 2015 - Federal Register (FR) Publication • FR + 1-30 days – Motions to Stay filed • FR + 30 days – Petitions for review of rule due • FR + 90 days – Comments due on Proposed Federal Plan • Fall/Winter 2015/16 - Potential ruling on Motions to Stay • Summer 2016 - Finalization of model trading rules • September 6, 2016 –State “Plans” Due (FIP risk after this) • Summer/Fall 2016 – Earliest DC Circuit Crt. Of App. decision • Summer/Fall 2017 – Earliest SCOTUS ruling on appeal • September 6, 2018 – Final State Plans Due • 2022-2029 – Interim compliance stair-steps (interim rates) • 2030 – Final budgeted rates must be met
EPA Statement About New Gas Power “Emission reductions achieved through the use of new NGCC capacity require the construction of additional CO2-emitting generating capacity, a consequence that is inconsistent with the long-term need to continue reducing CO2 emissions beyond the reductions that will be achieved through this rule.”
Mike Nasi mnasi@jw.com 512.236.2216 Questions?