Diabetic Nephropathy: Understanding, Screening, and Recommendations
690 likes | 774 Vues
Explore the prevalence, natural history, pathogenesis, staging, and screening methods for Diabetic Nephropathy. Review literature on measurements of urinary albumin and novel biomarkers. Learn about the diagnosis and staging of this condition.

Diabetic Nephropathy: Understanding, Screening, and Recommendations
E N D
Presentation Transcript
Diabetic nephropathy s.Jafarynodushan Fellow of endocrinology Research institute for endocrine sciences. ShahidBeheshti University of Medical Sciences. Jul.2017
Agenda • Prevalence • Natural history • Pathogenesis • Pathology • Staging • Screening • Measurements of urinary albumin (Literature review) • Recommendations • Diagnosis • Normoalbuminuric renal impairment in diabetes(Literature review) • novel biomarkers for the early detection of Diabetic nephropathy • Surveillance
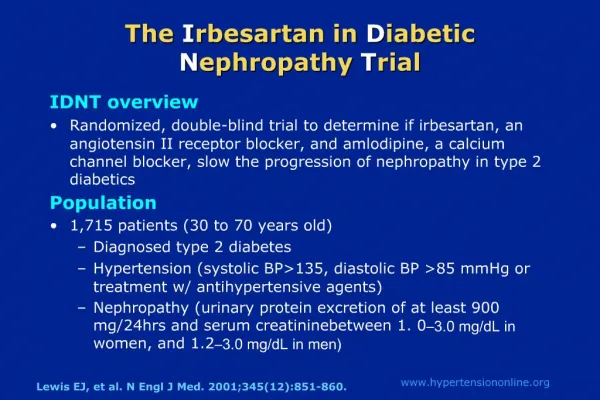
prevalence • Diabetic kidney disease, or CKD attributed to diabetes, occurs in 20–40% of patients with diabetes and is the leading cause of end-stage renal disease (ESRD). • Diabetic kidney disease typically develops after a diabetes duration of 10 years, or at least 5 years in type 1 diabetes,butmay be present at diagnosis of type 2 diabetes
Natural history of diabetic nephropathy WILLIAMS TEXTBOOK OF ENDOCRINOLOGY,13THEDITION
Pathogenesis WILLIAMS TEXTBOOK OF ENDOCRINOLOGY,13THEDITION
Glomerular classification of DN Class I : Mild or nonspecific LM changes and EM-proven GBM thickening Biopsy does not meet any of the criteria mentioned below for class II, III, or IV GBM 395 nm in female and 430 nm in male individuals 9 years of age and oldera ClasIIa: Mild mesangial expansion Biopsy does not meet criteria for class III or IV Mild mesangial expansion in ˃25% of the observed mesangium Journal of the American Society of Nephrology, 2010
Class IIb: Severe mesangial expansion Biopsy does not meet criteria for class III or IV Severe mesangial expansion in ˃25% of the observed mesangium Class III : Nodular sclerosis (Kimmelstiel– Wilson lesion) Biopsy does not meet criteria for class IV At least one convincing Kimmelstiel– Wilson lesion Journal of the American Society of Nephrology, 2010
Class IV: Advanced diabetic glomerulosclerosis Global glomerular sclerosis in ˃50% of Glomeruli Lesions from classes I through III Journal of the American Society of Nephrology, 2010
Tubulointerstitial and VascularLesions in DN Journal of the American Society of Nephrology, 2010
Screening of DN Screening should include: ● Measurements of urinary albumin ● Measurement of serum creatinine and estimation of GFR American Journal of Kidney Diseases, 2007
Measurements of urinary albumin (Literature review)
OBJECTIVE To compare the diagnostic performance of the UAC vs the ACR in random urine samples for microalbuminuria screening among patients with DM. STUDY SELECTION Clinical studies assessing the UAC or the ACR of random urine samples in detecting the presence of microalbuminuria among patients with DM using a urinary albumin excretion rate of 30 to 300mg/d in 24-hour timed urine collections as the criterion standard
MAIN OUTCOMES AND MEASURES : The primary end pointwas the diagnostic performance measures of the UAC or the ACR in random urine samples, as well as comparisons between them. RESULTS : We identified 14 studies, with a total of 2078 patients; 9studies reported on the UAC, and 12 studies reported on the ACR. Meta-analysis showed pooled sensitivities of 0.85 and 0.87 for the UAC and the ACR, respectively, and pooled specificities of 0.88 and 0.88,respectively. No differences in sensitivity (P = .70), specificity (P = .63), or diagnostic odds ratios (P = .59) between the UAC and the ACR were found. The time point of urine collection did not affect the diagnostic performance of either test.
Conclusions The UAC and the ACR yielded high sensitivity and specificity for the detection of microalbuminuria. Because the diagnostic performance of the UAC is comparable to that of the ACR, our findings indicate that the UAC of random urine samples may become the screening tool of choice for the population with DM, considering the rising incidence of DM and the constrained health care resources in many countries.
OBJECTIVE : To assess the performance of measurements of urinary albumin concentration (UAC) and urinary albumin: creatinine ratio (UACR) in a diurnal random urine specimen (RUS) for the screening of diabetic nephropathy
RESEARCH DESIGN AND METHODS: A total of 95 ambulatory NIDDM patients(49 women, ages 40-75 years) collected 123 RUSs during the morning after completing a timed 24-h urine collection. Albumin was measured by immunoturbidimetry. According to timed urinary albumin excretion rate (UAER) measured in the 24-h collection (criterion standard), samples were classified as normoalbuminuric (UAER <20 ug/min; n = 54), microalbuminuric (UAER 20-200 ug/min; n = 44), and macroalbuminuric (UAER >200 ug/min; n = 25). The receiver operating characteristics (ROC) curve approach was used. The ROC curves of UAC and UACR in RUS for screening of microalbuminuria (normo- and microalbuminuric samples; n = 98) and macroalbuminuria (micro- and macroalbuminuric samples; n = 69) were plotted
Conclusion Albumin measurements (UAC and UACR) in an RUS presented almost perfect accuracy for the screening of micro- and macroalbuminuria and UAC measured in an RUS is simpler and less expensive than UACR and UAER. It is suggested as a valid test for use in screening for diabetic nephropathy.
Recommendations Screening • At least once a year, assess urinary albumin (e.g., spot urinary albumin–to– creatinine ratio) and estimated glomerular filtration rate in patients with type 1 diabetes with duration of ≥5 years, in all patients with type 2 diabetes, and in all patients with comorbid hypertension. B
Screening… • Screening for albuminuria can be most easily performed by urinary albumin–to– creatinine ratio (UACR) in a random spot urine collection • Timed or 24-h collections are more burdensome and add little to prediction or accuracy. • Measurement of a spot urine sample for albumin alone without simultaneously measuring urine creatinine(Cr) is less expensive but susceptible to false-negative and false positive determinations as a result of variation in urine concentration due to hydration
Screening… • Normal UACR is generally defined as˂30 mg/g Cr, and increased urinary albumin excretion is defined as ≥30 mg/g Cr. • because of biological variability in urinary albumin excretion, two of three specimens of UACR collected within a 3- to 6-month period should be abnormal before considering a patient to have albuminuria. • Exercise within 24 h, infection, fever , congestive heart failure, markedhyperglycemia, menstruation, and marked hypertension may elevate UACR independently of kidney damage.
eGFR should be calculated from serum Cr using a validated formula. The Chronic Kidney Disease Epidemiology Collaboration (CKD-EPI) equation is generally preferred • An eGFR ˂60 mL/min/ 1.73 m2 is generally considered abnormal, though optimal thresholds for clinical diagnosis are debated
Diagnosis of Diabetic Kidney Disease • Diabetic kidney disease is usually a clinical diagnosis made based on the presence albuminuria and/or reduced eGFRin the absence of signs or symptoms of other primary causes of kidney damage. • The typical presentation of diabetic kidney disease is considered to include a long-standing duration of diabetes, retinopathy, albuminuria without hematuria, and gradually progressive kidney disease.
Diagnosis… • Signs of CKD may be present at diagnosis or without retinopathy in type 2 diabetes, and reduced eGFRwithout albuminuria has been frequently reported in type 1 and type 2 diabetes and is becoming more common over time as the prevalence of diabetes increases in the U.S. • It is rare for patients with type 1 diabetes to develop kidney disease without retinopathy. In type 2 diabetes, retinopathy is only moderately sensitive and specific for CKD caused by diabetes, as confirmed by kidney biopsy.
Diagnosis… • An active urinary sediment (containing red or white blood cells or cellular casts), rapidly increasing albuminuriaor nephrotic syndrome, rapidly decreasing eGFR, or the absence of retinopathy (in type 1 diabetes) may suggest alternative or additional causes of kidney disease. For patientswith these features, referral to a nephrologist for further diagnosis.
Normoalbuminuric renal impairment in diabetes(Literature review)
OBJECTIVE: About 20% of diabetic patients with chronic kidney disease (CKD) detected from the new ADA recommendations (albumin excretion rate ˃30mg/24 h or GFR]˂60 ml/min per 1.73 m2) may be normoalbuminuric. Do the characteristics and outcome differ for subjects with and without albuminuria? RESEARCH DESIGN AND METHODS: A total of 89 patients (mean age 64 ± 11 years )with diabetes(type1 and type2) and a MDRD estimated GFR (e-GFR) ˂60 underwent a 51Cr-EDTA B- isotopic GFR determination. The AER was determined on one 24-h urine collection and they were followed up for 38 ± 11 months.
RESULTS: A total of 15 subjects (17%) were normoalbuminuricmean MDRD e-GFR was 41.3 ±13.1 ml/min per 1.73m2 (11–59.9), it did not significantly differ from their isotopic GFR (45.6 ± 29.7, P = 0.12), Most of the normoalbuminuric patients (71%) had serum creatinine levels in the normal range. Despite their lower serum creatinine levels, their MDRD e-GFR did not significantly differ from the albuminuric group.
The primary outcome was requirement for dialysis, or death. The secondary outcomes were the AER and serum creatinine for living nondialyzed patients at the end of the follow-up
Conclusion • Although their Cr is usually normal, most of the normoalbuminuric diabetic subjects with CKD according to an MDRDe-GFR below 60 ml/min per 1.73m2 do really have a GFR below 60 ml/min per 1.73 m2. However, as expected, because of normoalbuminuria and other favorable characteristics, their risk for CKD progression or death is lower. • Further studies on the outcome of normoalbuminuric CKD in diabetes are required to demonstrate that the awareness of this condition is a benefit
OBJECTIVE : This multicenter study examined the impact of albumin excretion rate (AER) on the course of estimated glomerular filtration rate (eGFR) and the incidence of sustained eGFR ˂ 60 in type 1 diabetes up to year 14 of the Epidemiology of Diabetes Interventionsand Complications (EDIC) study (mean duration of 19 years in the Diabetes Control and Complications Trial [DCCT]/EDIC).
RESEARCH DESIGN AND METHODS : 1,439 participants had normal GFR (serum creatinine ≤1.3 mg/dl and/or creatinine clearance˃ 100 ml/min/1.73 m2)were examined. At baseline, the AER was˂40 mg/24 h for the primary prevention cohort and ˂200 mg/24 h for the secondary intervention cohort. Urinary albumin measurements from 4-h urine collections were obtained from participants annually during the DCCT and every other year during the EDIC study, and serum creatinine was measured annually in both the DCCT and EDIC study. GFR was estimated from serum creatinine using the abbreviated MDRD equation. Analyses used all AER and eGFR values from the 1,439 participants over the 23 years of the DCCT/EDIC study.
RESULTS : A total of 89 of 1,439 subjects developed an eGFR˂ 60 ml/min/1.73 m2 (stage3 chronic kidney disease on two or more successive occasions (sustained) during the DCCT/EDIC study (cumulative incidence 11.4%). Of these, 20 (24%) had AER˂30 mg/24 h at all prior evaluations, 14 (16%) had developed microalbuminuria (AER 30–300 mg/24 h) before they reached stage 3 chronic kidney disease, and 54 (61%) had macroalbuminuria (AER˃300 mg/24h) before they reached stage 3 chronic kidney disease. Macroalbuminuria is associated with a markedly increased rate of fall in eGFR(5.7%/year vs. 1.2%/year with AER ˂30 mg/24 h, P ˂0.0001) and risk of eGFR˂ 60 ml/min/1.73 m2 (adjusted hazard ratio 15.3, P ˂ 0.0001), whereas microalbuminuria had weaker and less consistent effects on eGFR.