Download
1 / 24
240 likes | 325 Vues
Understand effects of motion, similarity, proximity on experiments, learn variability, optimize experimental design for accurate results.

E N D
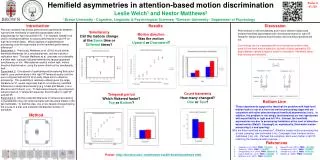
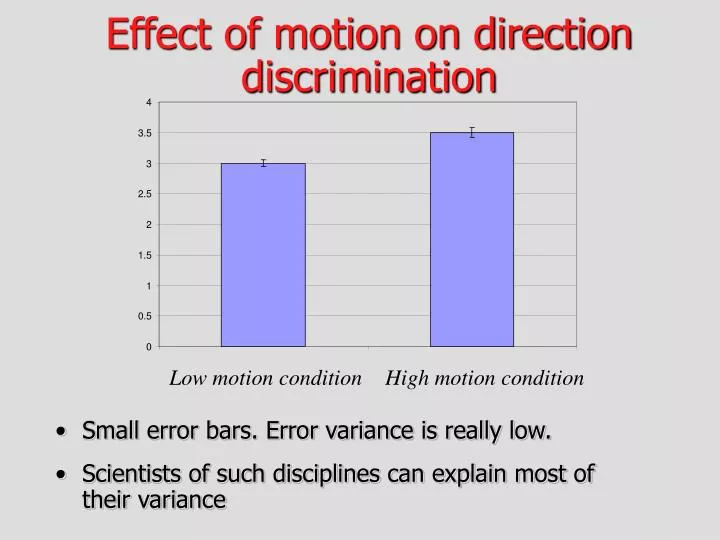
4 3.5 3 2.5 2 1.5 1 0.5 0 Effect of motion on direction discrimination • Small error bars. Error variance is really low. • Scientists of such disciplines can explain most of their variance Low motion condition High motion condition
Effect of similarity of objects on categorization 4.5 • Larger error bars. Error variance is still low. • Scientists of such disciplines can explain a lot of their variance 4 3.5 3 2.5 2 1.5 1 0.5 0 Low similarity High similarity
5 4.5 4 3.5 3 2.5 2 1.5 1 0.5 0 Effect of proximity on group performance • Very large error bars. Error variance is high. • Scientists of such disciplines can explain only a small percentage of variance • Note. Mean remains the same Low Proximity High proximity
Percentage of variance in usability? LargeMediumSmallVariable
Functions of experimental Design • Reduce the error variance, so that you can get focus on the question that you are interested in • Experimental statistics make assumptions about the data, experimental design helps you keep statistically hones.
First rule of statistics • Garbage in, garbage out! The most sophisticated statistical techniques cannot save you if your design in flawed
What is experimental design • The design is the general structure of the experiment. • Experimental design and the research problem are really two separate things. • Experiment design is not inevitable, i.e., every research problem can be investigated in many ways.
An example • Research question: Can people create better presentations with MultiPoint than PowerPoint • Independent Variable: Presentation tool. • 2 Levels: MultiPoint and PowerPoint • Dependent Variable: Quality of presentation. • Quality defined by independent judgment of presentation
Between Subjects Designs • Two group, between subjects design • Method: Call two groups into the lab, randomly assign them to groups. Some use PowerPoint, some use MultiPoint. • Results:
Within Subjects Designs • One group, within subjects design • Method: Call one group into the lab, randomly assign them to different orders of using PPoint and MPoint • Results: Design: AB design
AB Design • Takes care of Fatigue and Learning Effects • Variations: ABBA design
The main function of experimental design is • to maximize the effect of systematic variance (the independent variable) • to minimize the error variance (often individual differences) • Error Variance can be of different kinds: • measurement error • random differences between experimental groups (do your best to eliminate this) • Individual differences within group (not much you can do)
Review: The Design of Experiments • Sources of variances in an experiment • Notation Experimental Manipulation Systematic Variance Error Variance: Due to Individual Differences Error Variance: Due to random factors
Between Subject Design: Sources of variance Experimental Manipulation: Individual Differences between users Random Variance
Within subject design Experimental Manipulation: Effect of device Random Variance
Methods to control Error Variance • Randomization • Elimination • Matching • Additional Independent Variable • Statistical Control Most of these methods address individual differences variance
Randomization • Most effective way to control error variance. If thorough randomization has been achieved then experimental groups can be considered equal in every way, and you are justified in comparing them. • Random Selection: random selection of units from the population • Random Assignment: Every experimental unit (subject or material) has an equal chance of being in every condition.
Random Assignment with control • Sometime you cannot totally randomly assign • Example: you need to control for gender in the PPoint / MPoint study • Randomly assign from within the gender groups to the Multipoint / PowerPoint groups
Elimination or Constancy • Sometimes you can control a possible confounding by eliminating it (or eliminating its effect). • Choose the subjects so that they are equal on the confounding variable. • Example: PPoint and MPoint experiment • Important confounding variable: previous experience in using Powerpoint. • Solution: You could decide that you are only interested in people who have done between ten and 20 PPoint presentations before and eliminate everyone else from the sample.
Elimination contd. • By reducing the difference between participants, we reduce the size of random variance and increase chances of finding meaningful differences. • Problems with method: Loss of generalizability
Matching • Match subjects to variable which is substantially related to the dependent variable. • Example: Previous multimedia experience can act as a confounding variable in the study. • People who have multimedia experience will tend to do better presentations, and use Mpoint more effectively • Solution: Match subjects. Recruit 10 subjects, get a baseline measure of their multimedia skills. Try to make sure that mean multimedia skill in equal in both groups. • Problems with Matching: reduces availability of subjects Note. The above example pertains to a between subjects design
Confounding variables that act differently at different levels of the IV • Pose a much bigger problem • Example: • Multimedia experience will benefit MPoint usage more than PPoint usage • Such a variable can lead to statistically uninterpretable results
Additional Independent Variable • If the confounding variable actually interests you, you can add it into your design • Example: Can people with Multimedia experience use Mpoint better than people without multimedia experience. • 2nd Independent Variable: Previous experience with Multimedia. • Design: 2 x 2 design.
Usability of a Palmtop Device • Possible Relevant Factors • Screen size • Screen resolution • Screen color • Hardware configuration