Download
1 / 19
210 likes | 400 Vues
Structural Differences of the Brazilian Stock Market. Shawn Leahy, Sary Levy- Carciente , H. Eugene Stanley, Dror Y. Kenett. Outline . Purpose Theoretical Perspective Methodology Similar Analyses Brazil at a glance Results Conclusion. Purpose.

E N D
Structural Differences of the Brazilian Stock Market Shawn Leahy, Sary Levy-Carciente, H. Eugene Stanley, Dror Y. Kenett
Outline • Purpose • Theoretical Perspective • Methodology • Similar Analyses • Brazil at a glance • Results • Conclusion
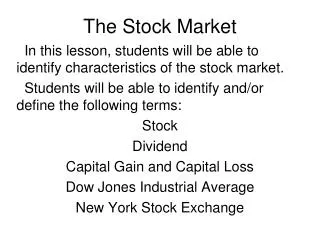
Purpose Understanding the structure and dynamics of financial markets We look at the effect of the market index on the correlations of its components and how they change over time There are different types of markets with different types of connections and relationships so the results of one market do not necessarily hold for all We use the Brazilian stock market as it has a better behavior before, during and after the most recent financial crisis Can we find a way to distinguish stock market healthy growth from the formation of a bubble?
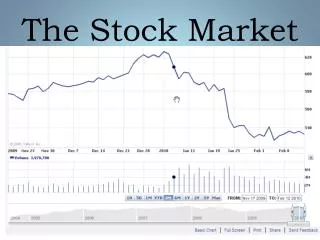
Theoretical Perspective Brazilian Index Price and S&P 500 Price S&P Price IBOVESPA Price Transformusing: ri(t) = log Pi [ (t) ] − log Pi [ (t −1) ]
M IJ Stock Correlations • C(i, j) =<(r(i) −< r (i)>)⋅ (r(j) − <r (j)>)> σi ⋅σ j Without Index With Index
Partial Correlations • The partial correlation (residual correlation) between i and j given a mediating variable m, is the correlation between i and j after removing their dependency on m; thus, it is a measure of the correlation between i and j after removing the affect of m on their correlation M I J PC(i, j |m) = C(i, j) − C(i,m)⋅C(j,m) √(1−C2( (i,m))⋅ (1− C2( (j,m))
Similar Analyses Correlations over time of S&P 500 stocks in U.S. Correlations Among stocks Partial Correlations Excluding The index Dror Y. Kenett, YoashShapira, AsafMadi, Sharron Bransburg-Zabary, GititGur-Gershgoren, and Eshel Ben-Jacob (2011), Index cohesive force analysis reveals that the US market became prone to systemic collapses since 2002, PLoS ONE 6(4): e19378
Similar results have been found for other markets such as U.K., Germany, Japan, and India • U.K. Germany, and U.S. all track each other closely • Japan and India are not as uniform, but still follow time dependence Kenett DY, Raddant M, Lux T, Ben-Jacob E (2012) Evolvement of Uniformity and Volatility in the Stressed Global Financial Village. PLoS ONE 7(2): e31144. doi:10.1371/journal.pone.0031144
Data for Brazilian Stock Market • 29 Brazilian Stocks from 1/03 - 12/13
Methods For Analyses of Brazilian Stock Market • Adjusted stock daily closing prices logarithmic returns • A short time window, of 22-trading days used • Correlations of all stocks and partial correlations between the stocks excluding the index • At each window we calculate stock correlation (partial) matrices, and average themto obtain a vector of correlations (partial) • Also we take another average of the correlations (partial) to obtain the overall market correlation for that window
Brazil at a Glance • Sao Paulo Stock Exchange Index (IBOVESPA) • 8th-13thlargest stock exchange in the world
Results Correlations Among stocks Identical Partial Correlations Excluding Index
How similar are the two measures? This market then cannot be said to be index driven, and the jump in correlations are not being pushed by feedback from the index.
Before, During, and After Crisis Correlation of stock correlations as a function of correlation of stock returns for pre-crisis period of 2003-2007 (top), crisis period of 2008-2009 (middle) and the post-crisis period of 2010-2013 (bottom). Pre-Crisis During Crisis Post Crisis
What does the structure of a non-index driven market look like? A hierarchical tree where the linkage to discern differences is the magnitude of the average correlations Pre Crisis Finance Utilities Telecommunications Construction/Basic Materials Consumer Capital Goods Oil Post Crisis
Interpretation • Not driven by the index, but due to an actual intra-stock correlations. Market correlations and the daily closing price of the Index from 2003-2013
Conclusions • We have found differences in the structures and dynamics of the Brazilian Stock market compared to developed stock markets • The Brazilian stock market has shown to not be driven by its index • Could be reason for better behavior during and after crisis, we could be in presence of a possible measure asan early warning signal for the health of stock markets and distinguishing growth from bubbles
Further Research • There are many types of markets in the world • Much more work needs to be done to look at the structure of other emerging markets
End • Thank You! • Questions?