Download
1 / 58
630 likes | 950 Vues
Purposes of Elections. Regular free elections guarantee mass political action enable citizens to influence the actions of their government Popular election confers on a government the legitimacy that it can achieve no other way.

E N D
Purposes of Elections • Regular free elections • guarantee mass political action • enable citizens to influence the actions of their government • Popular election confers on a government the legitimacy that it can achieve no other way. • Regular elections also ensure that government is accountable to the people it serves.
Purposes of Elections • Electorate • Citizens eligible to vote • Mandate: • A command, indicated by an electorate’s voters, for the elected officials to carry out their platforms. • Sometimes the claim of a mandate is suspect because voters are not so much endorsing one candidate as rejecting the other.
Kinds of Elections • Primary Elections: • Election in which voters decide which of the candidates within a party will represent the party in the general election. • Closed primary: a primary election in which only a party’s registered voters are eligible to vote. • Open primary: a primary in which party members, independents, and sometimes members of the other party are allowed to vote. • Crossover voting: participation in the primary of a party with which the voter is not affiliated. • Raiding: An organized attempt by voters of one party to influence the primary results of the other party.
General Elections • General elections are those in which voters decide which candidates will actually fill elective public offices. • In presidential elections voters look for: • Leadership and character. • Base their judgments on foreign policy and defense issues that do not arise in state and local elections.
Initiative, Referendum, and Recall • Initiative • An election that allows citizens to propose legislation and submit it to the state electorate for popular vote • 24 states and D.C. use the initiative • Referendum • An election whereby the state legislature submits proposed legislation to the state’s voters for approval • Recall • Voters can remove an incumbent from office by popular vote. • Are very rare
Presidential Elections • Primary elections or caucuses are used to elect national convention delegates which choose the nominee. • Winner-take-all primary • Proportional representation primary • Proportional representation with bonus delegates primary; beauty contest with separate delegate selection; delegate selection with no beauty contest • Caucus
Primaries v. Caucuses • Over years, trend has been to use primaries rather than caucuses to choose delegates. • Caucus is the oldest, most party-oriented method of choosing delegates to the national conventions. • Arguments for primaries • More democratic • More representative • A rigorous test for the candidate • Arguments for caucuses • Caucus participants more informed; more interactive and informative • Frontloading (being first) gives some primary states an advantage • Frontloading is the tendency to choose an early date on the primary schedule
The Party Conventions • Out-of-power party holds its convention first, in late July, followed in mid-August by party holding the presidency. • Conventions were decision-making body in the 19th century. • Today the convention is fundamentally different. Nominations settled well in advance of the convention.
National Conventions: The News Media • Changing nature of coverage • No prime time coverage on some days • Extending coverage on the final day of each convention • Reflects change in political culture • More interest in the candidates themselves • Convention still generates much coverage for the party
The National Convention: Who are the Delegates? • Parties draw delegates from an elite group • Higher income and educational levels • Differences between parties • 40% Democratic delegates were minorities; 50% women (1980 rule requires half state delegation be female) • Only 17% Republican delegates were minorities. Up from 9% in 2000.
The Electoral College • Representatives of each state who cast the final ballots that actually elect a president • Total number of electors for each state equal to the number of senators and representatives that a state has in the U.S. Congress • District of Columbia is given 3 electoral votes.
The Electoral College • Result of compromise • Selection by Congress versus direct popular election • Three essentials to understanding the design of the Electoral College: • Constructed to work without political parties. • Constructed to cover both the nominating and electing phases of presidential selection. • Constructed to produce a nonpartisan president.
The Electoral College in the 19th Century • 12th Amendment (1804) • Attempt to remedy the confusion between the selection of vice presidents and presidents that emerged in the election 1800 • Provided for separate elections for each office, with each elector having only one vote to cast for each • In event of a tie, the election still went to the House. • Top three candidates go to House. Each state House delegation casts one vote.
The Electoral College Today • Apportionment matters. • Representation of states in the Electoral College is altered every ten years to reflect population shifts. • Recent apportionment has favored the Republicans. • With the exception of California, George W. Bush carried all of the states that gained seats in 2000.
The Electoral College: Three Major Reform Ideas • Abolition • Congressional District Plan • Keep the College, Abolish the Electors
Patterns of Presidential Elections • Party Realignments • A shifting of party coalition groupings in the electorate that remains in place for several elections • Critical elections • An election that signals a party realignment through voter polarization • Six party realignments in U.S. history; three associated with tumultuous elections • 1860 • 1890s • 1928-1936 • Secular Realignments • The gradual rearrangement of party coalitions, based more on demographic shifts than on shocks to the political system
Electoral College Results for Three Realigning Presidential Contests
Congressional Elections • Very different from presidential elections • Lesser known candidates, more difficulty getting media attention • Incumbency Advantage 95.11% of incumbents who sought reelection were successful from 1982-2004 • When incumbents lose it is generally due to: • Redistricting • Gerrymandering • Scandals • Coattails
Midterm Congressional Elections • Election takes place in the middle of a presidential term • President’s party usually loses seats in midterms • Tendency for voters to punish the president’s party more severely in the sixth year of an eight year presidency • Retrospective voting • Senate elections less inclined to the 6th year itch • 2002 midterm elections were an exception • Bush picked up seats in the House and Senate
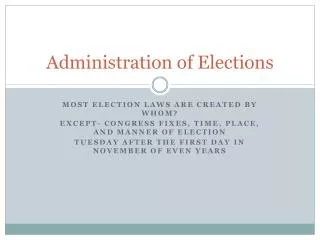
Apportionment and Redistricting • Apportionment • Proportional process of allotting congressional seats to each state following the ten year census • 1929: House size fixed at 435. • Redistricting • Redrawing of congressional districts to reflect increases or decreases in seats allotted to the states, as well as population shifts within a state • Baker v. Carr requires districts to be equal in population.
Current Apportionment Congressional Apportionment 2003-2013 9 2 1 1 5 8 1 2 2 1 8 29 10 15 1 5 2 19 5 3 4 13 18 9 19 4 1 3 53 7 11 8 4 9 6 13 9 9 5 3 4 7 7 14 4 36 6 1 27 2
Texas to Pick up 4 House Seats • A review of preliminary 2010 Census data by Election Data Services (EDS) points toward a Republican advantage in the 2012 election. The Census Bureau releases their official report in late December. • EDS projections suggest gains by “Red States” such as Texas (+4), Florida (+2), Arizona (+1), Georgia (+1), South Carolina (+1) and Utah (+1). “Swing State”Nevada and “Blue State”Washington also may gain one seat each. • When some states gain, other states must lose. The brunt of the lost seats will occur in Blue States: New York (-2), Illinois (-1), Iowa (-1), Massachusetts (-1), Michigan (-1), New Jersey (-1) and Pennsylvania (-1). Swing States Ohio (-2) and Missouri (-1) are expected to lose seats along with Red State Louisiana (-1). • The net results: Red States +9, Blue States -7 and Swing States -2.
Voting Behavior • Patterns in Voter Turnout • Turnout: the proportion of the voting-age public that votes • 40% of the eligible adult population votes • 25% are occasional voters • Voters tend to be more educated • More voters have higher incomes • Younger people vote less • Whites vote more regularly than African Americans – related to income and educational differences in the two groups • Hispanics vote less than African Americans • Have potential to wield much influence given their increasing size • Those interested in politics vote more
Why Is Voter Turnout So Low? • Too Busy • Difficulty of Registration • Difficulty of Absentee Voting • Number of Elections • Voter Attitudes • Weak Political Parties
How Can the United States Improve Voter Turnout? • Easier Registration and Absentee Voting • Make Election Day a Holiday • Strengthen Parties
Does Low Turnout Matter? • Some argue it is a not a critical problem • Based on belief that preferences of nonvoters are not much different from those who do vote • So…results would be the same regardless • Nonvoting is voluntary • Nonvoting driven by acceptance of the status quo • Others believe it is a problem • Voters do not represent nonvoters • Social make-up and attitudes of nonvoters today are significantly different from those of voters • Tend to be low income, younger, blue collar, less educated and more heavily minority
Patterns in Vote Choice • Race and Ethnicity • Whites tend to vote Republican • African Americans vote overwhelmingly for Democrats • Hispanics also tend to identify with and vote for Democrats • Kerry 53 percent; Bush 44 percent • Women today more likely to support Democratic candidates • Poor vote less often and more for Democrats • Well-to-do vote more often and for Republicans • Ideology related closely to vote choice • Conservatives for Republicans • Liberals for Democrats
Ticket-Splitting • Voting for candidates of different parties for various offices in the same election • From 1960 to 1992 almost 40% of states holding simultaneous presidential and gubernatorial elections recorded split results. • 1992 and 1996 went to average of 26% split ticket voting
Reforming the Electoral Process • Focus on the Electoral College • Other areas • Nomination • Regional primaries • Campaign Finance • Internet Voting • Standardizing Recounts • Ballot Reform
Campaign Process Elements • Finance: raise money • Publicity • Unpaid coverage (media) • Campaign events • Press conferences • Debates
Recurring reform themes • Limit the disproportionate influence of wealthy individuals and special interest groups on the outcome of federal elections; • Regulate spending in campaigns for federal office; and • Deter abuses by mandating public disclosure of campaign finances (“transparency”).
Terms / concepts • Soft money: contributions to national parties not subject to contribution limits. • PAC: Political Action Committee (“multi-candidate committee) • Independent expenditures: made without coordination with candidate / campaign • Issue ads: political advertising not directly affiliated with specific candidate, but oriented toward specific issue or cause.
Modern campaign finance laws • 1883 – Pendleton Act (Civil Service) • 1907 – ban on direct contributions by corporations • 1947 – ban on direct contributions by labor unions • 1971 / 1974 – Federal Election and Campaign Act (established limits & FEC) • 1976: Supreme Court decision in Buckley v. Valeo • 2002: Bipartisan Campaign Reform Act
1974 FECA • 1. Created Federal Elections Commission. • 2. Allowed for federal funding for presidential candidates (matching funds with voluntary limits). • 3. Required public disclosure of contributions & spending. • 4. Placed limits on campaign spending if a candidate accepted federal matching funds.
1974 FECA • 5. Set contribution limits: • $1,000 limit any individual can give to federal candidate in the primary, & $1,000 in per candidate in general election. $5,000 limit per individual per campaign by a "multi-candidate organization" (Political Action Committee.) • Limited amounts of their own money candidates could spend on their own campaigns. (Struck down in Buckley v Valeo) • Limited amounts of other people’s money candidates could spend (i.e. tried to establish expenditure ceilings in US congressional races.) (Struck down in Buckley v Valeo)
Campaign Finance Reform: Is it Necessary? • We often hear politicians rail against the system of financing political campaigns. • But is it really broken? • Or, more to the point, are stiffer laws restricting contributions the answer?
The Lay of Campaign Finance Land… • Bipartisan Campaign Reform Act (BCRA) -- a.k.a. “McCain-Feingold”
2004 House Candidate Averages (All) OpenSecrets.org (FEC Data)
OpenSecrets.org (FEC Data) 2004 House Incumbents Average
2004 Senate Candidates Averages (All) OpenSecrets.org (FEC Data)
OpenSecrets.org (FEC Data) 2004 Senate Incumbents Averages
Campaign Spending in Competitive Races 1972 – 2004Races which an incumbent received less than 60 % of the major party vote in the previous election.
Largest Sources of Campaign Funds: • Individual contributions (by far) • PACs • Political Parties (less so the case) • Personal Contributions
Hard and Soft Money Spent by House Campaign Committees 1992-2004