Download
1 / 50
510 likes | 712 Vues
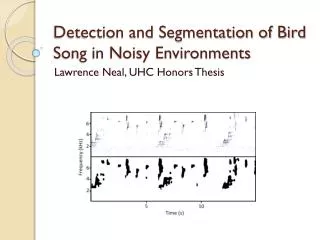
Detection and Segmentation of Bird Song in Noisy Environments. Lawrence Neal, UHC Honors Thesis. Bioacoustics Project. Bird Species Identifiable by species Presence/Absence, activity data is useful Bird activity may shift in response to climate change, ecological factors.

E N D
Detection and Segmentation of Bird Song in Noisy Environments Lawrence Neal, UHC Honors Thesis
Bioacoustics Project • Bird Species • Identifiable by species • Presence/Absence, activity data is useful • Bird activity may shift in response to climate change, ecological factors
Automated Recording • Song Meter automated recorders • Collected May-August beginning 2009
Audio Data Analysis • Involves several steps: • Extracting Bird Sound from Audio • Identifying Bird Species • Mapping species data back to sites
Audio Data Analysis • Involves several steps: • Extracting Bird Sound from Audio (Segmentation) • Identifying Bird Species • Mapping species data back to sites
Segmentation • Time-Domain Segmentation • Separates audio into multiple clips • Energy Thresholding, Onset/Offset Detection • Has been applied to bird song • Harma 2003, Fagerlund 2004, Lee 2008
Segmentation • Time-Domain Segmentation
Segmentation • Time-Domain Segmentation • Cannot separate overlapping sounds
Segmentation • Time-Frequency Segmentation • Segment regions of the 2D spectrogram
Segmentation • Spectrogram Segmentation • Similar to image segmentation
Spectrograms • Two-dimensional representation of sound • Audio amplitude at each (time, frequency) • Generated by short-time Fourier Transform Male voice saying 'nineteenth century'. Violin playing (note harmonics)
Spectrograms • Tradeoffs in parameters • Larger STFT size • Higher freq. resolution
Spectrograms • Tradeoffs in parameters • Shorter step size • Higher time resolution
Spectrogram Segments • Each segment is a continuous region • Defined by a binary mask over the spectrogram
Spectrogram Segments • Can be converted back to audio with inverse STFT, or left as 2D segments
Segmentation Methods • Per-Pixel Random Forest • Trains on one feature vector per pixel • Outputs probability per-pixel • Superpixel Merger Method • First splits spectrogram into ‘superpixels’ • Trains on one feature vector per superpixel • Second classifier trains per superpixel pair • Outputs connected sets of superpixels
Random Forest • Supervised Classifier • Trains on human-provided data with labels • “Feature Vector” of values, each with yes/no label • Learns to mimic the human’s labels • Based on decision trees: • Tree is traversed with feature vector X • Each interior node is a decision of the type: • If (Xd < θ)go left; else go right • Each leaf node contains a class label • In this case, two classes: ‘Bird Sound’ and ‘Negative’
Random Forest • Constructed by recursive procedure • Check if all remaining examples are the same • If so, finish with a leaf node • Select a random subset of features • For each one, find the optimal split (highest Gini) • Choose the (feature, split) pair for maximum Gini coefficient and create new interior node • Split the examples and recursively create two child nodes • Classification is a vote among all trees
Per-Pixel Training • Hand-Drawn mask over spectrogram • Pixels are randomly sampled
Per-Pixel Training • Feature vector includes: • Pixel Frequency • Window Variance • All window pixel values
Per-Pixel Output • Probability Mask over the spectrogram • Threshold is applied to extract segments
Per-Pixel Limitations • Scope is limited to window size • High threshold causes oversegmentation • Low threshold causes undersegmentation • Slow- must classify for each pixel
Superpixel Method • Begins with an initial pre-segmentation • Modification of Simple Linear Iterative Clustering (SLIC) image segmentation • Uses computed features that describe regions of the spectrogram • Segments are sets of superpixels
Superpixel Clustering • Based on SLIC method: • Each pixel is assigned a 5-valued vector • (X,Y, L, a, b) for position and color • Locally-constrained K-Means Clustering • Each centroid searches only a radius of 2S • S = sqrt(N/K) • Creates a set of regularly-sized regions • Some regions’ boundaries follow the edges of larger objects in the image
Superpixel Clustering • Over-segments an image • Edges of clusters arealong image edges • But, doesn’t workfor spectrograms
Superpixel Clustering • Spectrograms lack edges • Also, only one channel of color • Instead of (x,y,L,a,b), we use a new vector: • (x, y, B, V, Gx, Gy, Px, Py)
Superpixel Clustering • X,Y values • Time and frequency values in the spectrogram • B, V • Pixel values after Gaussian blur, variance of pixel values • Gx,Gy • Horizontal/Vertical Sobel Gradient values • Px, Py • Time and Frequency values of nearest peak (weighted by Gaussian kernel)
Foreground/Background Classifier • Random Forest trained using the same manual spectrogram labels as per-pixel • Each superpixel is labeled positive (foreground) if more than 10% of its area overlaps with a positive-labeled region • Feature vector describes superpixel: • Mean and variance of pixel values, blurred pixel values, peak frequencies • Histogram of Oriented Gradients
Superpixel Merger Classifier • Random Forest trained to classify pairs of adjacent superpixels • Positive classification: Merge together • Negative classification: Split apart • After background pixels are discarded, all remaining edges between superpixels are classified • All edges above a threshold are merged
Evaluation Datasets • HJ Andrews dataset, 625 recordings • Each 15 seconds long • Drawn 2 each from 24 hours • “Set A” dataset, 166 recordings • All from early and mid morning • Paired by year, 2009/2010
Future Work • Superpixel Method is promising • Faster than per-pixel classification • Could use more sophisticated merger technique
Bibliography • A. Harma, “Automatic identification of bird species based on sinusoidal modeling of syllables,” in IEEE International Conference on Acoustics Speech and Signal Processing, April 2003, pp. 545–548. • Chang-Hsing Lee, Chin-Chuan Han, and Ching-Chien Chuang, “Automatic classification of bird species from their sounds using two-dimensional cepstralcoefficients,” IEEE Transactions on Audio, Speech, and Language Processing, vol. 16, no. 8, pp. 1541 – 1550, 2008. • Leo Breiman, “Random forests,” Machine Learning, pp. 5–32, January 2001. • Fagerlund, Seppo. Automatic Recognition of Bird Species by Their Sounds. Master’s Thesis, HELSINKI UNIVERSITY OF TECHNOLOGY, Laboratory of Acoustics and Audio Signal Processing. Nov. 8, 2004