Segmentation and Edge Detection
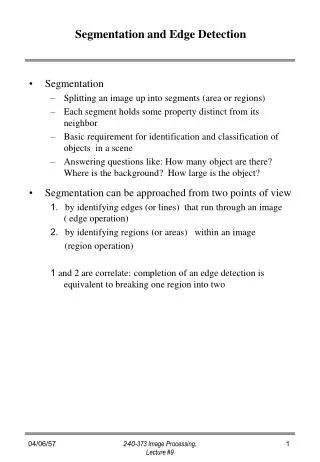
Segmentation and Edge Detection. Segmentation Splitting an image up into segments (area or regions) Each segment holds some property distinct from its neighbor Basic requirement for identification and classification of objects in a scene

Segmentation and Edge Detection
E N D
Presentation Transcript
Segmentation and Edge Detection • Segmentation • Splitting an image up into segments (area or regions) • Each segment holds some property distinct from its neighbor • Basic requirement for identification and classification of objects in a scene • Answering questions like: How many object are there? Where is the background? How large is the object? • Segmentation can be approached from two points of view 1. by identifying edges (or lines) that run through an image ( edge operation) 2. by identifying regions (or areas) within an image (region operation) 1 and 2 are correlate: completion of an edge detection is equivalent to breaking one region into two 240-373 Image Processing, Lecture #9
Region Operations • Required to cover a substantial area of the scene rather than a small group of pixels Technique 1: Crude region detection USE: To reconsider an image as a set of regions. OPERATION: The regions are simply identified as continuous pixels of the same gray level. The boundaries of the regions are at the cracks between the pixels rather than at pixel positions. • This technique may give too many regions to be useful • bunching (quantizing) technique can be used to reduce number of regions 240-373 Image Processing, Lecture #9
Region Merging Technique 2: Region merging USE: To reduce the number of regions, to combine fragment regions, to determine which regions are really part of the same area. OPERATION: • Let s be a crack differece, i.e. the absolute difference in gray levels between two adjacent (above, below, left, or right) pixels • Then given a threshold value, T, we can identify for each crack i.e. w=1 if the crack is below the threshold (the regions are likely to be the same), or 0 if it is above the threshold. • Measure the full length of the boundary of each of the regions that meets at the crack. These will be b1 and b2. • Sum the w’s that are along the length of the crack between the region and calculate • If this is greather than a further threshold, deduce that the two regions should be joined 240-373 Image Processing, Lecture #9
Region merging example If we make T=3, then all the cracks are significant Sum of w’s Region Boundary With A With B With C A 17 - 9 0 B 10 9 - 4 C 4 0 4 - 240-373 Image Processing, Lecture #9
Giving sum/min(b1,b2) for A, B, and C as follows: Region A B C A - 0.9 0 B 0.9 - 1.0 C 0 1.0 - • If we take the threshold for combining as 0.95, then B will be combined with C. • If the combining threshold is set lower, then A will also be combined giving the whole image as just one region. • The algorithm combines the small region (4) with the larger region (2), rather than the two larger regions (1-2). • Size of the region can be used instead of the length of the region boundary. 240-373 Image Processing, Lecture #9
Region Splitting Technique 3: Region splitting USE: To subdivide part of an image into regions of similar type OPERATION: • Identify significant peaks in the gray-level histogram • Look in the valleys between the peaks for possible threshold values. • Find splits between the best peaks first LIMITATIONS: • This technique relies on the overall histogram (Multiple chessboards example) • Example 0 ********************** 1 **** the valley is at 1 2 ********* 3 ***************** 4 ******** 240-373 Image Processing, Lecture #9
Which side should the 1’s go? • Consider both options (0), (1,2,3,4) (0,1), (2,3,4) OOOOOO . O . . OOOOOO . O . . OOO . OOO . . . OOOOOOO . . . OO . O . . . . . . OO . O . . . . . . OO . . . . . . . . OOO . . . . . . . O . O . . . . . . . OOO . . . . . . . OO . . . . . . . . OOO . . . . . . . The second option less stragglers than the first but is is difficult to see this without trying it. COMMENT: • The histogram could just be of a region within the image 240-373 Image Processing, Lecture #9