Download

1 / 13
130 likes | 244 Vues
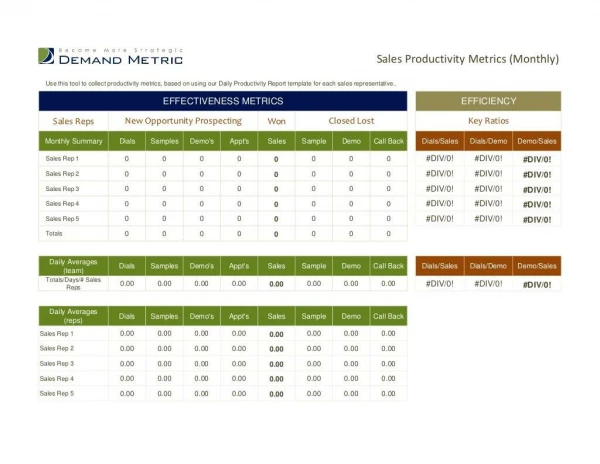
This report presents the quality metrics for February 2011, detailing various key performance indicators across grants, contact logs, designations, and technical assistance requests. The monthly totals include grants at 406, with a daily average of 20. Contact logs registered a total of 17,345, yielding a weekday average of 642. Additionally, designations accounted for 719 totals, with a weekday average of 25.68. Technical assistance requests numbered 45, averaging 3 daily. The report highlights trends and averages crucial for assessing organizational performance.

E N D
Keys to Quality Monthly Metrics February 2011
Keys to Quality February 2011 Metrics – Grants • Monthly Total: 406 • Daily Average: 20
Keys to Quality February 2011 Metrics – Grants Cont’d • Monthly Average: 390
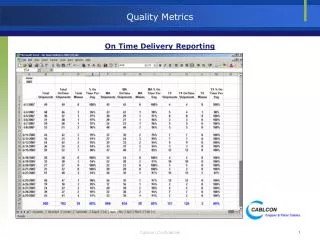
Keys to Quality February 2011 Metrics – Contact Logs • Monthly Total: 17,345 • Weekday Average: 642
Keys to Quality February 2011 Metrics – Contact Logs Cont’d • Monthly Average: 19,927
Keys to Quality February 2011 Metrics - Designations • Monthly Total: 719 • Weekday Average: 25.68
Keys to Quality February 2011 Metrics – Designations Cont’d • Monthly Average: 564
Keys to Quality February 2011 Metrics – TA Requests • Monthly Total: 45 • Daily Average: 3
Keys to Quality February 2011 Metrics – TA Requests Cont’d • Monthly Average: 130
Keys to Quality February 2011 Metrics – TA Requests by Status
Keys to Quality February2011 Metrics – Progress Interactions • Monthly Total: 394 • Daily Average: 15
Keys to Quality February 2011 Metrics – Progress Interactions Cont’d • Monthly Average: 535