Reclamation Mid-Term Operational Modeling
Reclamation Mid-Term Operational Modeling Seasonal to Year-Two Colorado River Streamflow Prediction Workshop CBRFC March 21-22, 2011. Katrina Grantz, PhD Upper Colorado Region Hydraulic Engineer. Reclamation Operational Modeling Overview. “Mid-Term” operations for the Colorado River

Reclamation Mid-Term Operational Modeling
E N D
Presentation Transcript
Reclamation Mid-Term Operational Modeling Seasonal to Year-Two Colorado River Streamflow Prediction Workshop CBRFC March 21-22, 2011 Katrina Grantz, PhDUpper Colorado Region Hydraulic Engineer
Reclamation Operational ModelingOverview • “Mid-Term” operations for the Colorado River • Operations of major reservoirs in the monthly to 2-year and beyond timeframe • 2 operational models • 24-Month Study (deterministic, official) • Mid-Term Ops Model (probabilistic, additional analysis)
24-Month Study • Reservoir Operations • 12 major reservoirs (9 UB, 3 LB) • Monthly timestep, ~2 years, updated monthly • Used for best guess at mid-term reservoir conditions (storage, elevation, release, hydropower)
24-Month Study: “Official model” • Annual Operating Plan (AOP) for all reservoirs • Determines operating tier for Lake Powell • August run of the 24-Month Study (sometimes April) • Official model projection for determining Lower Basin shortages • Secretary declares a shortage
3 categories of model assumptions • Inflows • Reservoir operations • Demands
24 Month Study: Inflows Upper Basin • Forecasted inflows issued by RFC/NRCS • Unregulated inflow • 1 trace • (3 if min/max month) Lower Basin • 5-year average for side inflows
24-Month Study: UB Inflows and Model Run Duration (Most Probable)
24-Month Study: UB Inflows and Model Run Duration (Max/Min Prob)
24-Month Study: Reservoir Operations • Up-to-date operations input by reservoir operators each month • Manual process: for each reservoir evaluate inflows, set releases, re-evaluate (sometimes an iterative process) • Coordination between Powell and Mead
24-Month Study: Demands Upper Basin • Implicit in unregulated inflow forecast • Based on assumptions in RFC models (consider historic and current use patterns) • Adjusts for wet/dry years Lower Basin • Actual approved water orders for the year • adjusted for ICS, paybacks, etc
24-Month Study: Output • AOP (written document) • 24-Month Study Report (mostly tabular data), monthly update to the AOP
Mid-Term Operations ModelMotivation • 24-Month Study currently a deterministic model • Upper Basin driven primarily by most probable inflow forecast • Lower Basin driven by scheduled demands • Need to better quantify range of possible operations in the Colorado River Basin
Mid-Term Operations Model • Model currently in development • Based on current 24-Month Study model • Accomodates ensemble forecast rather than most probable inflow forecast • Uses “rules” (prioritized logic) to set UC reservoir releases rather than manually set by operators
Mid-Term Operations Model Inflows • Model input is range of probable inflows • CBRFC’s ESP forecasts (30 traces) will drive first and second years of model • Ongoing research to develop forecasting techniques for beyond 2 years (2-10 yrs)
Mid-Term Operations ModelInflows • Model currently uses unregulated inflow ESP forecasts • Depletions are implicit in the forecast • Eventually want to move to natural inflow • Explicitly model water use
Mid-Term Operations Model Operations • Rules have been written, tested, and verified to set releases for all upper basin reservoirs • Good exercise, added documentation, transparency • Lower basin reservoirs are demand driven • No new rules needed to be written
Mid-Term Probabilistic Ops Model Model validation • Compared 24-MS official results against MTOM to verify reservoir rules • Evaluated min, most, max model runs for months in 2010 • Evaluated elevations and releases using
Questions we hope to better answer… • Back-to-back 8.23 years? Probability of equalization next year? Balancing? Shortage? What about two years out?
Mid-Term Ops Model: Expected Output • Probabilistic information and plots • Range of reservoir elevations • Range of reservoir releases • Probability of equalization • Probability of lower basin shortages
Colorado River Hydrology Workgroup • Research to improve Reclamation’s operations and planning on Colorado River • Focus on “applied” research
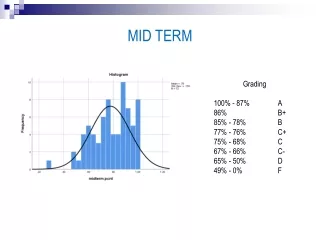
Distribution of Observed Inflow Volumes for Remainder of WY (Provided by RFC and Based on ESP Model Output) 9.52 MAF Volume determined from October 2009 Most Probable 24-Month Study. Volume required to trigger Equalization in WY2010 55% Probability of Equalization
Upper Basin SWE Powell Unregulated Inflow • Significant error in April 1st SWE – Inflow relationship • Need this info well before April
What we can provide: • Regulated inflow volume that would likely trigger equalization • % of average inflows to Powell that (if forecasted in April) could trigger equalization • Stakeholders can relate that to other variables
Min and Max Runs - Current Practice • Run in August, October, January, April • Min and Max probable inflows for current year only • Current year: 10th and 90th percentile official unregulated UB inflow forecast • Out-year: average historic (1976-2005) UB inflows • LB side inflows use 10th and 90th percentile of last 5 years (current year) and 5-yr avg (out-year)
Min and Max Runs - Request • Continue Min and Max probable analysis into the out-year • Current year: 10th and 90th forecast • Out-year: 25th and 75th of historic (1976-2005) inflows • Simulates dry year following dry year and wet year following wet year
Quick Analysis of Natural Flows • Considered bottom 10%and top 10% natural flow at Lee’s Ferry (1906-2007) • Following year: wet, normal, or dry (terciles)? • Makes sense to take min/max analysis into out year (for more reasons than one…)