Download
1 / 45
490 likes | 1.35k Vues
Chapter 9 Atomic Absorption and Atomic Fluorescence Spectrometry.

E N D
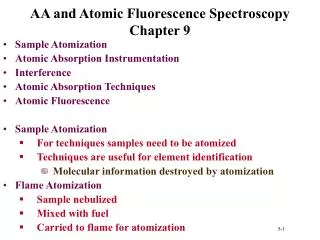
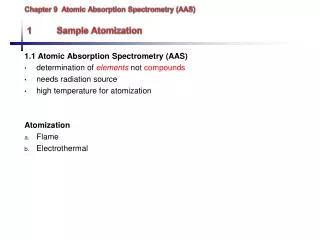
Chapter 9Atomic Absorption and Atomic Fluorescence Spectrometry Flame Atomization: In a flame atomizer, a solution of the sample is nebulized by a flow of gaseous oxidant, mixed with a gaseous fuel, and carried into a flame where atomization occurs. The following processes then occur in the flame. • Desolvation (produce a solid molecular aerosol) • Dissociation (leads to an atomic gas) • Ionization (to give cations and electrons) • Excitation (giving atomic, ionic, and molecular emission)
Types of Flames: Several common fuels and oxidants can be employed in flame spectroscopy depending on temperature needed. Temperatures of 1700oC to 2400oC are obtained with the various fuels when air serves as the oxidant. At these temperature, only easily decomposed samples are atomized. For more refractory samples, oxygen or nitrous oxide must be employed as the oxidant. With the common fuels these oxidants produce temperatures of 2500oC to 3100oC.
Burning Velocity: The burning velocities are of considerable importance because flames are stable in certain ranges of gas flow rates only. If the gas flow rate does not exceed the burning velocity, the flame propagates itself back in to the burner, giving flashback. As the flow rate increases, the flame rises until it reaches a point above the burner where the flow velocity and the burning velocity are equal. This region is where the flame is stable. At higher flow rates, the flame rises and eventually reaches a point where it blows off of the burner.
Flame Structure: Important regions of a flame include: • primary combustion zone • interzonal region • secondary combustion zone • Primary combustion zone: Thermal equilibrium is ordinarily not reached in this region, and it is, therefore, seldom used for flame spectroscopy.
2. Interzonal region: This area is relatively narrow in stoichiometric hydrocarbon flames, is often rich in free atoms and is the most widely used part of the flame for spectroscopy. 3. Secondary combustion zone: In the secondary reaction zone, the products of the inner core are converted to stable molecular oxides that are then dispersed into the surroundings.
Temperature Profiles: A temperature profile of a typical flame for atomic spectroscopy is shown in Fig. 9-3. The maximum temperature is located in the flame about 1 cm above the primary combustion zone. It is important– particularly for emission methods – to focus the same part of the flame on the entrance slit for all calibrations and analytical measurements.
Flame absorbance Profiles: Fig. 9-4 shows typical absorption profiles for three elements. Magnesium exhibits a maximum in absorbance at the middle of the flame. The behavior of silver, which is not readily oxidized, is quite different, a continuous increase in the number of atoms, and thus the absorbance, is observed from the base to the periphery of the flame. Chromium, which forms very stable oxides, shows a continuous decrease in absorbance beginning close to the burner tip.
Flame Atomizers: Figure 9-5 is a diagram of a typical commercial laminar flow burner that employs a concentric tube nebulizer. The aerosol is mixed with fuel. The aerosol, oxidant, and fuel are then burned in a slotted burner that provides a flame that is usually 5 or 10 cm in length.
Advantages: 1. Uniform dropsize 2. Homogeneous flame 3. Quiet flame and a long path length Disadvantages: 1. Flash back if Vburning > Vflow 2. ~90% of sample is lost 3. Large mixing volume
Performance Characteristics Of Flame Atomizers In terms of reproducible behavior, flame atomization appears to be superior to all other methods for liquid sample introduction. In terms of sampling efficiency and thus sensitivity, however, other atomization methods are markedly better. A large portion of the sample flows down the drain and the residence time of individual atoms in the optical path in the flame is brief (~10-4s).
Electrothermal Atomization It provides enhanced sensitivity because the entire sample is atomized in a short period, and the average residence time of the atoms in the optical path is a second or more. A few microliters of sample are first evaporated at a low temperature and then ashed at a somewhat higher temperature in an electrically heated graphite tube or in a graphite cup. Then the current is rapidly increased to several hundred amperes, which caused the temperature to soar to perhaps 2000oC to 3000oC; atomization of the sample occurs in a period of a few milliseconds to seconds.
Performance Characteristics: Electrothermal atomizers offer the advantage of unusually high sensitivity for small volumes of sample. Typically, sample volumes between 0.5 and 10 L are used; absolute detection limits lie in the range of 10-10 to 10-13 g of analyte. Furnace methods are slow-typically requiring several minutes per element. A final disadvantage is that the analytical range is low, being usually less than two orders of magnitude.
ATOMIC ABSORPTION INSTRUMENTATION Instruments for atomic absorption spectrometry (AAS) consist of a radiation source, a sample holder, a wavelength selector, a detector, and a signal processor and readout. The sample holder in atomic absorption instruments is the atomizer cell that contains the gaseous atomized sample.
1. Radiation Sources: It is necessary that band width of the radiation source must be narrow relative to the width of an absorption peak. The problem created by limited width of atomic absorption peaks has been solved by the use of line sources with bandwidths even narrower than absorption peaks.
Fig. 9-10a shows the emission spectrum of a typical atomic lamp source. With a suitable filter or monochromator, all but one of these lines are removed. Fig. 9-10b shows the absorption spectrum for the analyte between wavelengths 1 and 2. Passage of the line from the source through the flame reduces its intensity from P0 to P; the absorbance is then given by log(Po/P), which is linearly related to the concentration of the analyte in the sample. A disadvantage of the procedure is that separate lamp source is needed for each element.
Hollow Cathode Lamps: It is the most common source for atomic absorption measurements. This lamp consists of a tungsten anode and a cylindrical cathode sealed in a glass tube that is filled with neon or argon at a pressure of 1 to 5 torr. The cathode is constructed of the metal whose spectrum is desired. Ionization of the inert gas occurs when a potential on the order of 300 V is applied across the electrodes, which generates a current of about 5 to 15 mA.
… Hollow Cathode Lamps continued… If the potential is sufficiently large, the gaseous cation acquire enough kinetic energy to dislodge some of the metal atoms from the cathode surface and produce an atomic cloud in a process called sputtering. A portion of the sputtered metal atom are in excited states and thus emit their characteristic radiation as they return to the ground state. Eventually, the metal atoms diffuse back to the cathode surface or to the glass walls of the tube and are redeposited.
Electrodeless Discharge Lamps (EDLs): These provide radiant intensities that are usually one to two orders of magnitude greater than hollow cathode lamps. A typical lamp is constructed from a sealed quartz tube containing a few torr of an inert gas such as argon and a small quantity of the metal (or its salt) whose spectrum is of interest.
…Electrodeless Discharge Lamps (EDLs) continued… The lamp is energized by an intense field of radio-frequency or microwave radiation. Ionization of the argon occurs to give ions that are accelerated by the high-frequency component of the field until they gain sufficient energy to excite the atoms of the metal whose spectrum is sought. Electrodeless discharge lamps are available commercially for 15 or more elements.
Single-Beam Instruments: A typical single-beam instrument, consists of several hollow cathode sources, an atomizer, and simple grating spectrophotometer with a photomultiplier transducer. The 100% T adjustment is then made while a blank is aspirated into the flame. Finally, the transmittance is obtained with the sample replacing the blank.
Double-Beam Instruments: In double-beam instrument the beam from the hollow cathode source is split by a mirrored chopper, one half passing through the flame and the other half around it. The two beams are then recombined by a half-silvered mirror and passed into a grating monochromator; a photomultiplier tube serves as the transducer. The ratio between the reference and sample signal is then amplified and fed to the readout, which may be a digital meter or a signal recorder.
INTERFERENCES IN ATOMIC ABSORPTION SPECTROSCOPY 1. Spectral Interferences: (I) Spectral interference can occur due to overlapping lines. e.g. a vanadium line at 3082.11Å interferes in an analysis based upon the aluminum absorption line at 3082.15 Å. This type of interference can be avoid by employing the aluminum line at 3092.7 Å instead. (II) Spectral interferences result from the presence of combustion products that exhibit broadband absorption or particulate products that scatter radiation. Both diminish the power of the transmitted beam. A blank can be aspirated into the flame to make the correction.
…Spectral Interferences continued… (III) Source of absorption or scattering can be originated in the sample matrix. An example of a potential matrix interference due to absorption occurs in the determination of barium in alkaline earth mixture. The wavelength of Ba line used for atomic absorption analysis appears in the center of a broad absorption band for CaOH. The effect can be eliminated by substituting nitrous oxide for air as the oxidant which yields a higher temperature that decomposed the CaOH and eliminates the absorption band.
…Spectral Interferences continued… (IV) Concentrated solution of elements such as Ti, Zr and W which form refractory oxides can cause spectral interference due to scattering. (V) Organic solvent or organic impurities in the sample can cause scattering interference from carbonaceous particle because of incomplete combustion of the organic matrix.
2. Chemical Interferences: (I)Formation of Compounds of Low Volatility: The most common type of interference is by anions that form compounds of low volatility with the analyte and thus reduce the rate at which the analyte is atomized. The decrease in calcium absorbance that is observed with increasing concentrations of sulfate or phosphate. Example of cation interference have also been recognized. Aluminum is found to cause low results in the determination of magnesium, apparently as a result of the formation of a heat-stable aluminum/magnesium compound.
…Formation of Compounds of Low Volatility continued… Interference due to formation of species of low volatility can often be eliminated or moderated by use of higher temperatures. Releasing agents which are cations that react preferentially with the interferant and prevent its interaction with the analyte, can be employed. Protective agents prevent interference by forming stable but volatile species with the analyte. Three common reagents for this purpose are EDTA, 8-hydroxyquinoline, and APDC (ammonium salt of 1-pyrrolidinecarbodithioic acid).
…Chemical Interferences continued… (II) Dissociation Equilibria: Gaseous environment of a flame or a furnace, numerous dissociation and association reactions lead to conversion of the metallic constituents to the elemental state. Some of these reactions are reversible MO M + O M(OH)2 M + 2OH Where M is the analyte atom. VOx V + Ox AlOx Al + Ox TiOx Ti + Ox
…Chemical Interferences continued… (III)Ionization Equilibria: Ionization of atoms and molecules is small in combustion mixtures that involve air as the oxidant, and generally can be neglected. In higher temperatures of flames where oxygen or nitrous oxide serves as the oxidant, however, ionization becomes important, and a significant concentration of free electrons exists as a consequence of the equilibrium M M+ + e- The equilibrium constant K for this reaction takes the form K= [M+][e-] [M]
ATOMIC ABSORPTION ANALYTICAL TECHNIQUES Sample Preparation: A disadvantage of flame spectroscopic methods is the requirement that the sample be introduced into the excitation source in the form of a solution, most commonly an aqueous one. Unfortunately, many materials of interest, such as soils, animal tissues, plants petroleum products and minerals are not directly soluble in common solvents, and extensive preliminary treatment is often required to obtain a solution of the analyte in a form ready for atomization.
…Sample Preparation continued… Indeed, the decomposition and solution steps are often more time consuming and introduce more error than the spectroscopic measurement itself. Some of the common methods used for decomposing and dissolving samples for atomic absorption methods include treatment with hot mineral acids; oxidation with liquid reagents, such as sulfuric, nitric, or perchloric acids; combustion in an oxygen bomb or other closed container to avoid loss of analyte.
…Atomic absorption analytical techniques continued… Calibration Curves: Atomic absorption should follow Beer’s law with absorbance being directly proportional to concentration. In fact, however, departures from linearity are often encountered, and it is foolhardy to perform an atomic absorption analysis without experimentally determining whether or not a linear relationship does exist. A calibration curve that covers the range of concentrations found in the sample should be prepared.
…Atomic absorption analytical techniques continued… Standard Addition Method: It is widely used in atomic absorption spectroscopy in order to partially or wholly counteract the chemical and spectral interferences introduced by the sample matrix. Application of Atomic Absorption Spectrometry: It is a sensitive means for the quantitative determination of more than 60 metals or metalloid elements. The resonance lines for the nonmetallic elements are generally located below 200 nm, thus preventing their determination by convenient, nonvacuum spectrophotometers.