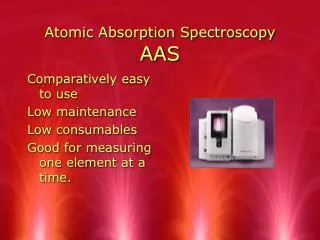
Atomic Absorption Spectroscopy
Atomic Absorption Spectroscopy. Atomic absorption spectroscopy is based on the same principle as the flame test used in qualitative analysis. The high temperature of the flame excites a valence electron to a higher-energy orbital.

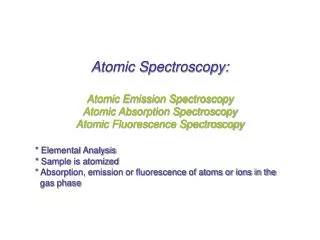
Atomic Absorption Spectroscopy
E N D
Presentation Transcript
Atomic absorption spectroscopy is based on the same principle as the flame test used in qualitative analysis.
The high temperature of the flame excites a valence electron to a higher-energy orbital. • The atom then emits energy in the form of light as the electron falls back into the lower energy orbital (ground state). The intensity of the absorbed light is proportional to the concentration of the element in the flame.
quantitative analysis Atomic Spectra
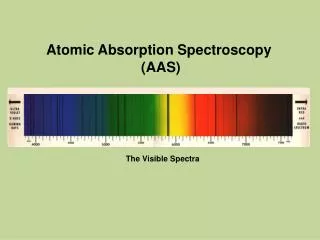
Each element has a characteristic spectrum. • Example: Na gives a characteristic line at 589 nm. • Atomic spectra feature sharp bands. There is little overlap between the spectral lines of different elements.
Atomic absorption spectroscopy and atomic emission spectroscopyare used to determine the concentration of an element in solution.
Applying Lambert-Beer’s law in atomic absorption • spectroscopy is difficult due to • variations in the atomization from the sample matrix • non-uniformity of concentration and path length of analyte atoms. Concentration measurements are usually determined from a calibration curve generated with standards of known concentration.
Light Source Hollow-cathode lamp: The cathode contains the element that is analysed. Atomization Desolvation and vaporization of ions or atoms in a sample: high-temperature source such as a flame or graphite furnace • Flame atomic absorption spectroscopy • Graphite furnace atomic absorption spectroscopy
1- Flame atomic absorption spectroscopy: Sample introduction:
Ionization Excitation Atomization Vaporization M* M+ + e_ Mo M* MA Mo + Ao Solid Solution Process in a Flame AA
Graphite furnace atomic absorption spectroscopy Sample holder: graphite tube • Samples are placed directly in the graphite furnace which is then electrically heated. • Beam of light passes through the tube.
Basic Graphite Furnace ProgramTHGA transversely heated graphite atomizer Three stages: 1. drying of sample 2. ashing of organic matter 3. vaporization of analyte atoms to burn off organic species that would interfere with the elemental analysis.
Clean Atomization Temp Pyrolysis Dry 2 Dry 1 Time Basic Graphite Furnace ProgramTHGA
Applications of Atomic Absorption Spectroscopy • water analysis (e.g.Ca, Mg, Fe, Si, Al, Ba content) • food analysis; analysis of animal feedstuffs ( e.g. Mn, Fe, Cu, Cr, Se, Zn) • analysis of additives in lubricating oils and greases (Ba,Ca, Na, Li, Zn, Mg) • analysis of soils • clinical analysis (blood samples: whole blood, plasma, serum; Ca, Mg, Li, Na, K, Fe)