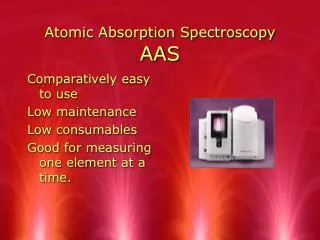
Atomic Absorption Spectroscopy
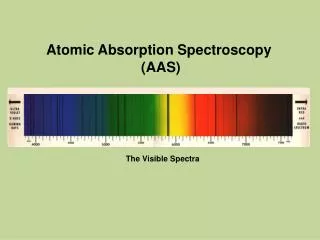
Atomic Absorption Spectroscopy. Atomic Emission Spectroscopy Lecture 18. Detection Limits.

Atomic Absorption Spectroscopy
E N D
Presentation Transcript
Atomic Absorption Spectroscopy Atomic Emission Spectroscopy Lecture 18
Detection Limits Usually, atomic absorption based on electrothermal atomization has better sensitivities and detection limits than methods based on flames. In general, flame methods have detection limits in the range from 1-20 ppm while electrothermal methods have detection limits in the range from 1-20 ppb.
This range can significantly change for specific elements where not all elements have the same detection limits. For example, detection limits fro mercury and magnesium using electrothermal atomization are 100 and 0.02 ppb while the detection limits for the same elements using flame methods are 500 and 0.1 ppm, respectively.
Accuracy Flame methods are superior to electrothermal methods in terms of accuracy. The relative error in flame method can be less than 1% while that for electrothermal method occurs in the range from 5-10%. Also, electrothermal methods are more susceptible to molecular interferences from the matrix components. Therefore, unless a good background correction method is used, large errors can be encountered in electrothermal methods depending on the nature of sample analyzed.
Flame Photometry The technique referred to as flame photometry is a flame emission technique. We introduce it here because we will not be back to flame methods in later chapters. The basics of the technique are extremely simple where a sample is nebulized into a flame. Atomization occurs due to high flame temperatures and also excitation of easily excitable atoms can occur.
Emission of excited atoms is proportional to concentration of analyte. Flame emission is good for such atoms that do not require high temperatures for atomization and excitation, like Na, K, Li, Ca, and Mg. The instrument is very simple and excludes the need for a source lamp.The filter is exchangeable in order to determine the analyte of interest and, in most cases, a photomultiplier tube is used as the detector.
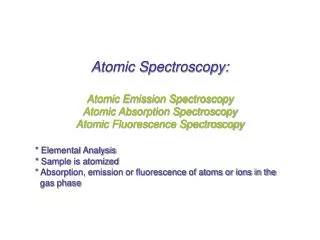
Atomic Emission Spectroscopy Atomic emission spectroscopy (AES), in contrast to AAS, uses the very high temperatures of atomization sources to excite atoms, thus excluding the need for lamp sources. Emission sources, which are routinely used in AES, include plasma, arcs and sparks, as well as flames. We will study the different types of emission sources, their operational principles, features, and operational characteristics. Finally, instrumental designs and applications of emission methods will be discussed.
Plasma Sources The term “plasma” is defined as a homogeneous mixture of gaseous atoms, ions and electrons at very high temperatures. Two types of plasma atomic emission sources are frequently used: • Inductively coupled plasma • Direct current plasma
Inductively Coupled Plasma (ICP) A typical ICP consists of three concentric quartz tubes through which streams of argon gas flow at a rate in the range from 5-20 L/min. The outer tube is about 2.5 cm in diameter and the top of this tube is surrounded by a radiofrequency powered induction coil producing a power of about 2 kW at a frequency in the range from 27-41 MHz. This coil produces a strong magnetic field as well.
Ionization of flowing argon is achieved by a spark where ionized argon interacts with the strong magnetic field and is thus forced to move within the vicinity of the induction coil at a very high speed. A very high temperature is obtained as a result of the very high resistance experienced by circulating argon (ohmic heating).
The top of the quartz tube will experience very high temperatures and should, therefore, be isolated and cooled. This can be accomplished by passing argon tangentially around the walls of the tube. A schematic of an ICP (usually called a torch plasma) is shown below:
The torch is formed as a result of the argon emission at the very high temperature of the plasma. The temperature gradients in the ICP torch can be pictured in the following graphics:
Plasma Appearance and Spectra A plasma torch looks very much like a flame but with a very intense nontransparent brilliant white color at the core (less than 1 cm above the top). In the region from 1-3 cm above the top of the tube, the plasma becomes transparent. The temperatures used are at least two to three orders of magnitude higher than that achieved by flames which may suggest efficient atomization and fewer chemical interferences.
The viewing region used in elemental analysis is usually about 6000 oC, which is about 1.5-2.5 cm above the top of the tube. It should also be indicated that argon consumption is relatively high which makes the running cost of the ICP torch high as well. Argon is a unique inert gas for plasma torches since it has few emission lines. This decreases possibility of interferences with other analyte lines.
Ionization in plasma may be thought to be a problem due to the very high temperatures, but fortunately the large electron flux from the ionization of argon will suppress ionization of all species.
The Direct Current Plasma (DCP) The DCP is composed of three electrodes arranged in an inverted Y configuration. A tungsten cathode resides at the top arm of the inverted Y while the lower two arms are occupied by two graphite anodes. Argon flows from the two anode blocks and plasma is obtained by momentarily bringing the cathode in contact with the anodes. Argon ionizes and a high current passes through the cathode and anodes.
It is this current which ionizes more argon and sustains the current indefinitely. Samples are aspirated into the vicinity of the electrodes (at the center of the inverted Y) where the temperature is about 5000 oC. DCP sources usually have fewer lines than ICP sources, require less argon/hour, and have lower sensitivities than ICP sources. In addition, the graphite electrodes tend to decay with continuous use and should thus be frequently exchanged. A schematic of a DCP source is shown below:
A DCP has the advantage of less argon consumption, simpler instrumental requirements, and less spectral line interference. However, ICP sources are more convenient to work with, free from frequent consumables (like the anodes in DCP’s which need to be frequently changed), and are more sensitive than DCP sources.