Atomic Absorption Spectroscopy
Learn about Atomic Absorption Spectroscopy, an Aussie invention by Alan Walsh, used for metal analysis by measuring the absorption of light to determine the concentration of gas-phase atoms.

Atomic Absorption Spectroscopy
E N D
Presentation Transcript
Atomic Absorption Spectroscopy Prof Mark A. Buntine School of Chemistry Dr Vicky Barnett University Senior College
Atomic Absorption Spectroscopy “This material has been developed as a part of the Australian School Innovation in Science, Technology and Mathematics Project funded by the Australian Government Department of Education, Science and Training as a part of the Boosting Innovation in Science, Technology and Mathematics Teaching (BISTMT) Programme.”
Professor Mark A. Buntine Badger Room 232 mark.buntine@adelaide.edu.au
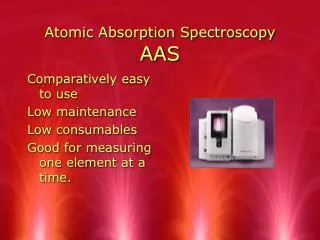
Atomic Absorption Spectroscopy • AAS is commonly used for metal analysis • A solution of a metal compound is sprayed into a flame and vaporises • The metal atoms absorb light of a specific frequency, and the amount of light absorbed is a direct measure of the number of atoms of the metal in the solution
Atomic Absorption Spectroscopy:An Aussie Invention • Developed by Alan Walsh (below) of the CSIRO in early 1950s.
Electromagnetic Radiation Sinusoidally oscillating electric (E) and magnetic (M) fields. Electric & magnetic fields are orthogonal to each other. Electronic spectroscopy concerns interaction of the electric field (E) with matter.
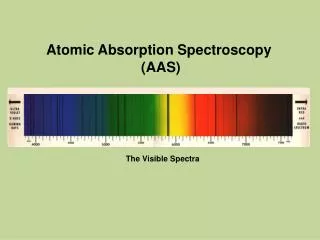
Frequency (Hz) 1020 1018 1016 1014 1012 108 Micro- wave -rays X-rays UV IR 10-11 10-8 10-6 10-3 Wavelength (m) Visible 400 500 600 700 800 nm The Electromagnetic Spectrum • Names of the regions are historical. • There is no abrupt or fundamental change in going from one region to the next. • Visible light represents only a very small fraction of the electromagnetic spectrum.
The Visible Spectrum l < 400 nm, UV 400 nm < l < 700 nm, VIS l > 700 nm, IR
The Electromagnetic Spectrum • Remember that we are dealing with light. • It is convenient to think of light as particles (photons). • Relationship between energy and frequency is:
Energy & Frequency • Note that energy and frequency are directly proportional. • Consequence: higher frequency radiation is more energetic. E.g. X-ray radiation (= 1018 Hz): 4.0 x 10⁶ kJ/mol IR radiation (= 1013 Hz): 39.9 kJ/mol (h = 6.626 x 10⁻³⁴ J.s)
Energy & Wavelength • Given that frequency and wavelength are related:=c/ • Energy and wavelength are inversely proportional • Consequence: longer wavelength radiation is less energetic eg.-ray radiation (= 10-11 m): 1.2 x 10⁷ kJ/mol Orange light (= 600 nm): 199.4 kJ/mol (h = 6.626 x 10⁻³⁴ J.s c = 2.998 x 10⁸ m/s)
photon Ground Excited state state Absorption of Light • When a molecule absorbs a photon, the energy of the molecule increases. • Microwave radiation stimulates rotations • Infrared radiation stimulates vibrations • UV/VIS radiation stimulates electronic transitions • X-rays break chemical bonds and ionize molecules
Absorption of Light • When light is absorbed by a sample, the radiant power P (energy per unit time per unit area) of the beam of light decreases. • The energy absorbed may stimulate rotation, vibration or electronic transition depending on the wavelength of the incident light.
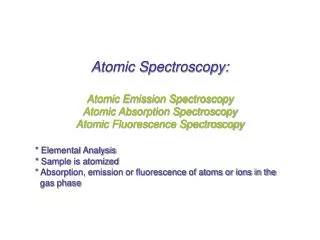
Atomic Absorption Spectroscopy • Uses absorption of light to measure the concentration of gas-phase atoms. • Since samples are usually liquids or solids, the analyte atoms must be vapourised in a flame (or graphite furnace).
Absorption and Emission Excited States Ground State Multiple Transitions Absorption Emission
Absorption Emission Absorption and Emission Excited States Ground State
Atomic Absorption • When atoms absorb light, the incoming energy excites an electron to a higher energy level. • Electronic transitions are usually observed in the visible or ultraviolet regions of the electromagnetic spectrum.
Atomic Absorption Spectrum • An “absorption spectrum” is the absorption of light as a function of wavelength. • The spectrum of an atom depends on its energy level structure. • Absorption spectra are useful for identifying species.
Atomic Absorption Spectroscopy • The analyte concentration is determined from the amount of absorption.
Atomic Absorption Spectroscopy • The analyte concentration is determined from the amount of absorption.
Atomic Absorption Spectroscopy • Emission lamp produces light frequencies unique to the element under investigation • When focussed through the flame these frequencies are readily absorbed by the test element • The ‘excited’ atoms are unstable- energy is emitted in all directions – hence the intensity of the focussed beam that hits the detector plate is diminished • The degree of absorbance indicates the amount of element present
Atomic Absorption Spectroscopy • It is possible to measure the concentration of an absorbing species in a sample by applying the Beer-Lambert Law: e= extinction coefficient
Atomic Absorption Spectroscopy • But what ifeis unknown? • Concentration measurements can be made from a working curve after calibrating the instrument with standards of known concentration.
AAS - Calibration Curve • The instrument is calibrated before use by testing the absorbance with solutions of known concentration. • Consider that you wanted to test the sodium content of bottled water. • The following data was collected using solutions of sodium chloride of known concentration
Calibration Curve for Sodium A b s o r b a n c e 1.0 0.8 0.6 0.4 0.2 2 4 6 8 Concentration (ppm)
Use of Calibration curve to determine sodium concentration {sample absorbance = 0.65} A b s o r b a n c e 1.0 0.8 0.6 0.4 Concentration Na+ = 7.3ppm 0.2 2 4 6 8 Concentration (ppm)
Atomic Absorption Spectroscopy • Instrumentation • Light Sources • Atomisation • Detection Methods
Light Sources • Hollow-Cathode Lamps (most common). • Lasers (more specialised). • Hollow-cathode lamps can be used to detect one or several atomic species simultaneously. Lasers, while more sensitive, have the disadvantage that they can detect only one element at a time.
Hollow-Cathode Lamps • Hollow-cathode lamps are a type of discharge lamp that produce narrow emission from atomic species. • They get their name from the cup-shaped cathode, which is made from the element(s) of interest.
Hollow-Cathode Lamps • The electric discharge ionises rare gas(Ne or Ar usually) atoms, which in turn, are accelerated into the cathode and sputter metal atoms into the gas phase.
Hollow-Cathode Lamps • The gas-phase metal atoms collide with other atoms (or electrons) and are excited to higher energy levels. The excited atoms decay by emitting light. • The emitted wavelengths are characteristic for each atom.
M* M + e M* M + Ar* M* M M* M +hn Hollow-Cathode Lamps collision-induced excitation M* spontaneous emission M
Hollow-Cathode Spectrum Harris Fig. 21-3: Steel hollow-cathode
Atomisation • Atomic Absorption Spectroscopy (AAS) requires that the analyte atoms be in the gas phase. • Vapourisation is usually performed by: • Flames • Furnaces • Plasmas
Flame Atomisation • Flame AAS can only analyse solutions. • A slot-type burner is used to increase the absorption path length (recall Beer-Lambert Law). • Solutions are aspirated with the gas flow into a nebulising/mixing chamber to form small droplets prior to entering the flame.
Flame Atomisation Harris Fig 21-4(a)
Flame Atomisation • Degree of atomisation is temperature dependent. • Vary flame temperature by fuel/oxidant mixture.
Furnaces • Improved sensitivity over flame sources. • (Hence) less sample is required. • Generally, the same temp range as flames. • More difficult to use, but with operator skill at the atomisation step, more precise measurements can be obtained.
Inductively Coupled Plasmas • Enables much higher temperatures to be achieved. Uses Argon gas to generate the plasma. • Temps ~ 6,000-10,000 K. • Used for emission expts rather than absorption expts due to the higher sensitivity and elevated temperatures. • Atoms are generated in excited states and spontaneously emit light.
Inductively Coupled Plasmas • Steps Involved: • RF induction coil wrapped around a gas jacket. • Spark ionises the Ar gas. • RF field traps & accelerates the free electrons, which collide with other atoms and initiate a chain reaction of ionisation.
Detection • Photomultiplier Tube (PMT).pp 472-473 (Ch. 20) Harris
Photomultiplier Tubes • Useful in low intensity applications. • Few photons strike the photocathode. • Electrons emitted and amplified by dynode chain. • Many electrons strike the anode.