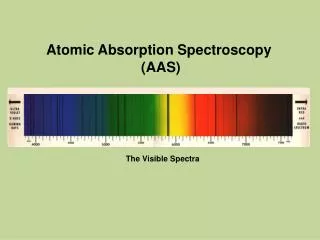
Chapter 8 & 9 Atomic Absorption Spectroscopy. Atomic Absorption Process. A neutral atom in the gaseous state can absorb radiation and transfer an electron to an excited state.
By albertAtomic Absoption Spectroscopy. CH4003 Lecture Notes 18 (Erzeng Xue) . energy D E. n = 1 n = 2 n = 3, etc. 4f. 4d. n=4. 4p. 3d. 4s. Energy. n=3. 3p. 3s. n=2. 2p. 2s. n=1. 1s. Introductory to Spectroscopy. Atomic Spectra. Electron excitation
By ariadneANALYSIS OF ASH AND MINERALS. Introduction. Ash content is a measure of the total amount of minerals present within a food Mineral content is a measure of the amount of specific inorganic components present within a food such as Ca, Na, K and Cl. Importance of Ash Analysis.
By valiantFluorescence. Topics. Definition Instrumentation Sensitivity (nM-pM) Contrast UV-vis measurements Derivatization Laser-induced Fluorescence. definitions. Singlet . v 7. v 7. v 5. v 5. v 3. v 3. v 1. v 1. v 5. v 3. v 1. Molecular Fluorescence. Absorption
By albertAtomic Absorption Spectroscopy (AAS). The Visible Spectra. Energy. Ba. Increasing Frequency .
By stromAtomic Absorption Spectroscopy. Lecture 14. Performance Characteristics of Electrothermal Atomizers.
By alenaWeek 5, Lesson 2. Chapter 7 - Spectroscopy. Electromagnetic Spectrum. All forms of spectroscopy use a part of the electromagnetic spectrum to give information about the materials around us. Electromagnetic radiation interacts with atoms and molecules.
By taveYear 12 Chemistry. Unit 3 – AOS 1 Chemical Analysis. Quantitative and Qualitative Analysis. Qualitative Analysis: - Identification of chemicals present Quantitative Analysis: - Identification of how much of each chemical is present. Physical Properties.
By sulwynSeminar on MAGNETIC MICROSPHERES Presented by Ushasri Department of Industrial pharmacy University college of pharmaceutical sciences KAKATIYA UNIVERSITY. CONTENTS INTRODUCTION DEFINITION RATIONALE OF THE DRUG DELIVERY SYSTEM ADVANTAGES AND DISADVANTAGES
By kuengArsenic Detection Techniques. Loveland Tech4good Luke Whitaker / May 27, 2014. Arsenic Detection Techniques. Environmental Protection Agency (EPA) Standard. On January 22, 2001 the EPA set the standard concentration in drinking water to be 10 µg/L See Document 40 CFR Parts 9, 141, and 142
By petraPhase 1. Collection of fly ash specimens. Collected 20 different fly ashes (13 Class C and 7 Class F) 15 of them ( 9 class C ashes and 6 class F ashes) are currently on the INDOT list of approved pozzolanic materials
By caitirQuiz Time. 05:00. 04:00. 03:00. 02:00. 01:30. 01:00. 00:45. 00:30. 00:15. 00:00. ????????????????????????????. Last Week. Synthesized chloropentaaminocobalt chloride [Co(NH 3 ) 5 Cl]Cl 2 Determine theoretical yield (mass) of product. Goals for This Week.
By raananLecture 5. Photometric methods of analysis. Assistant of the pharmaceutical chemistry department Burmas Nataliya Ivanivna e-mail: Natashenka-Burmas@rambler.ru. Plan. Main characteristics of photometric methods of analysis.
By zarielMEDICAL GEOLOGY/GEOCHEMISTRY PILLALAMARRI ILA Earth Atmospheric & Planetary Sciences Neutron Activation Analysis Laboratory Massachusetts Institute of Technology Cambridge, MA 02139 IAP 2006: 12.091 Credit Course: January 9 - 23, 2006 Session 3A - January 18, 2006.
By ishanaAnemia and iron deficiency are the most frequent nutritional problems on the worldwide scale. Haemoglobin, the\niron containing metalloprotein in the red blood cells, transports oxygen from the lungs to the rest of the body, where\nit releases its load of the oxygen. Depletion of iron concentration leads to inhibition of haemoglobin synthesis\ncausing iron deficiency anemia. Mainly women are at the risk of developing iron deficiency. Taking this into\nconsideration estimation of iron concentration and haemoglobin level from blood samples of 96 working women\nvolunteers from various age groups is carried out. Haemoglobin level estimated by using CMG method and iron\nconcentration determined by atomic absorption spectroscopy technique. In the samples iron concentration and\nhaemoglobin level are found to be in the range of 119 to 970 ppm and 8.8 to 18.7 g/dL respectively. 44 cases\nshowed haemoglobin level lower than the normal range indicating anemic condition. On the other hand iron\nconcentration and haemoglobin level in 10 cases was found to be in the normal range. 37 cases showed iron\nconcentration lower than normal range though haemoglobin level was within normal reference range. Iron concentration and haemoglobin level in remaining 5 cases was found to be more than normal range.
By SunainaWhat are instrumental techniques?. Modern chemists use a range of instruments to analyse and identify substances. Most produce quantitative data, which requires expert interpretation.
By kruegerkAtomic Absorption Spectroscopy. Yash Purohit Block 4. AAS Uses. Measures the light absorbed by the atoms of a sample then compares it to a set of known standard concentration It used in different ways for different fields of work Mining:
By bdwyerView Atomic absorption spectroscopy PowerPoint (PPT) presentations online in SlideServe. SlideServe has a very huge collection of Atomic absorption spectroscopy PowerPoint presentations. You can view or download Atomic absorption spectroscopy presentations for your school assignment or business presentation. Browse for the presentations on every topic that you want.