Atomic Absorption Spectroscopy (AAS)
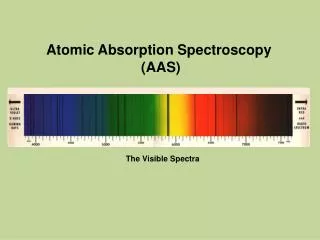
Atomic Absorption Spectroscopy (AAS). The Visible Spectra. Energy. Ba. Increasing Frequency .

Atomic Absorption Spectroscopy (AAS)
E N D
Presentation Transcript
Atomic Absorption Spectroscopy (AAS) The Visible Spectra
Ba Increasing Frequency A photon with an energy equal to the energy difference between the levels is released or absorbed in the process. The frequency νat which the spectral line occurs is related to the photon energy E by Planck's law E = hνwhere h is Planck's constant. The AAS technique can be used to analyze the concentration of over 70 different metals in a solution.
In physics, atomic spectral lines are of two types: An emission lineis formed when an electron makes a transition from a particular discrete energy level of an atom, to a lower energy state, emitting a photon of a particular energy and wavelength. A spectrum of many such photons will show an emission spike at the wavelength associated with these photons. An absorption lineis formed when an electron makes a transition from a lower to a higher discrete energy state, with a photon being absorbed in the process. These absorbed photons generally come from background continuum radiation and a spectrum will show a drop in the continuum radiation at the wavelength associated with the absorbed photons.
A continuum spectrumresults when the gas pressures are higher, so that lines are broadened by collisions between the atoms until they are smeared into a continuum. We may view a continuum spectrum as an emission spectrum in which the lines overlap with each other and can no longer be distinguished as individual emission lines. Emission spectraare produced by thin gases in which the atoms do not experience many collisions (because of the low density). The emission lines correspond to photons of discrete energies that are emitted when excited atomic states in the gas make transitions back to lower-lying levels. An absorption spectrumoccurs when light passes through a cold, dilute gas and atoms in the gas absorb at characteristic frequencies; since the re-emitted light is unlikely to be emitted in the same direction as the absorbed photon, this gives rise to dark lines (absence of light) in the spectrum.
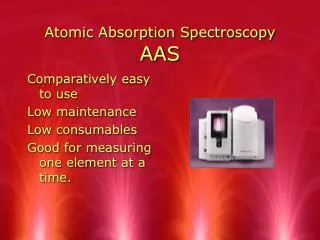
Flame atomic absorption spectroscopy (AAS) is the most used of atomic methods.
Flame AAS Flame technique allows for the analysis of cations in the mg/L range.
PMT – the photomultiplier tube: Facilitates the conversion of photons to electronic impulses.
Concentration to Absorbance compute a linear calibration curve ◊ ◊ Corr Coeff = 0.999937 Absorbance ◊ ◊ ◊ Concentration
Absorbance to Concentration Apply unknown absorbance to linear calibration curve ◊ ◊ Absorbance Corr Coeff = 0.999937 ◊ ? ◊ ◊ Concentration