Chapter 7 - Spectroscopy
Week 5, Lesson 2. Chapter 7 - Spectroscopy. Electromagnetic Spectrum. All forms of spectroscopy use a part of the electromagnetic spectrum to give information about the materials around us. Electromagnetic radiation interacts with atoms and molecules.

Chapter 7 - Spectroscopy
E N D
Presentation Transcript
Week 5, Lesson 2 Chapter 7 - Spectroscopy
Electromagnetic Spectrum • All forms of spectroscopy use a part of the electromagnetic spectrum to give information about the materials around us. • Electromagnetic radiation interacts with atoms and molecules. • The nature of the interaction depends on the energy of the electromagnetic radiation.
Electronmagnetic Spectrum cont… • The various spectroscopic techniques provide us with information about: • The type of atom or molecule that is present • How much of a particular atom or molecule is present • The structure and bonding of the molecule. • Spectroscopic techniques utilise the fact that: • Atoms or molecules absorb and emit electromagnetic radiation of specific energies • Atoms and molecules undergo a change when they adsorb electromagnetic radiation • Different parts of the electromagnetic spectrum affect different parts of the atom or molecule.
Electromagnetic Spectrum cont… • Radiation from each portion of the electromagnetic spectrum has a specific frequency, wavelength and energy associated with it. • Ultraviolet light is very short wave radiation with high energy, while radio waves have long wavelengths and low energy. • The energy of the radiation determines which part of an atom or molecule is affected.
Electromagnetic Spectrum cont… • In each of the spectroscopic techniques, the atom or molecule absorbs a specific quantum energy which causes the atom or molecule to move to a higher energy level. • With atoms, we look at the movement of electrons to higher energy levels. • With molecules, as well as the movement of electrons to higher energy levels, we observe the movement of molecules to higher vibrational, rotational and nuclear spin energy levels. • Like the electronic energy level, all of these energy levels are quantised; they have certain fixed values. • In each case the energy difference between the quantum levels is given by the equation ΔE = hv
Analysis of Atoms • Flame tests, atomic emission spectroscopy and atomic absorption spectroscopy use radiation from the visible region of the electromagnetic spectrum to give us information about the elements present in a sample.
Flame Tests • Chemists use the fact that some metals produce particular colours when they are heated as a convenient method of analysis. • The metallic elements present in a compound can often be determined simply by inserting a sample of the compound into a non-luminous Bunsen burner flame. • The metal is identified by comparing the flame colour with a list of the characteristic colours produced by metals.
Flame Tests cont… • An electron can jump to a higher energy level if it absorbs energy that corresponds exactly to the different in energy between the lower energy level and the higher energy level. • When electrons jump to a higher energy level they move to a higher energy subshell in a different shell. • Higher energy levels are unstable so the excited electrons quickly return to lower energy levels, emitting the energy they had absorbed. • If the energy emitted falls within the band of energies visible to the eye, it can be seen as coloured light. • The energy of a photon of light emitted by an excited electron has a fixed value, equal to the difference in between the higher energy level and the lower energy level to which it returns. • The light therefore has a specific wavelength and colour.
Flame Tests cont… • Electrons in an atom can be excited to a number of higher energy levels, so light emitted from a sample placed in a flame is likely to be a mixture of several different colours. • Violet light, the highest form of visible light, has a relatively short wavelength. • While red light has low energy and a longer wavelength.
Flame Tests cont… • Flame tests can give only limited qualitative information about the likely elements present in a sample. • Only a few elements give a coloured flame in a Bunsen Burner flame, and the colours of some are alike. • In impure sample a fainter colour may be masked by a stronger one.
Atomic Emission Spectroscopy • Two modifications greatly improve the usefulness of the technique: • Using a hotter flame, so that sufficient energy is available to excite electrons in a wider range of elements. • Passing the light through a prism. The different energies in the light emitted by a heated sample are separated into a series of coloured lines, called an emission spectrum. • Because each element has a different number of protons in the nucleus, the attraction of the nucleus for electrons will vary from element to element.
Atomic Emission Spectroscopy cont… • No two elements will therefore have energy levels of exactly the same energy, so a spectrum is characteristic of a particular element. • Each line in the emission spectrum corresponds to radiation of a specific wavelength, frequency and energy exactly equal to the difference in energy of the electron energy levels. • Because the energy levels have a specific value, discrete lines appear rather than a continuous spectrum. • Separating the light from the flame into its individual wavelengths – the atomic emission spectrum – allows the use of an atomic emission spectroscopy to obtain a more certain qualitative analysis.
Atomic Absorption Spectroscopy • Looking at the light absorbed, rather than the light emitted, is key to a method of analysing metal that is much more sensitive and accurate than AES. • It can also be used to identify and measure a wider range of metals. • This is known as atomic absorption spectroscopy.
Atomic Absorption Spectroscopy cont… • It is one of the most widely used modern instrumental techniques. • It is very versatile, as it is capable of detecting over 70 elements. • It is extremely sensitive, detecting concentrations of elements at parts per million, or in some cases parts per billion.
Uses of AAS… • Mercury levels in fish • Urine and blood analysis to detect an excess or deficiency of metals. • Analysis of toxic metals in food and drink • Environmental sampling – testing for metal ions pollution of air, soil and water • Assays of mineral and soil samples to determine the type and amount of metals present. • Analysis of metals present in engine oil to predict the possibility of engine failure.
How does AAS work? • Alan Walsh, creator of AAS, found that atoms will absorb light if the energy of the light is exactly that required to promote an electron from its normal energy level to a higher one. • Because each element has a unique absorption spectrum, each element analysed requires its own light source that will emit light of the correct wavelength. • The light is provided by a hollow source cathode lamp. • The cathode is composed of the element of interest and when this is vapourised it produces light of the correct wavelength required for the analysis.
How does AAS work cont… • A solution of the sample to be analysed is sprayed into a flame where it is converted into an atomic vapour. • Light containing the chosen wavelength is passed through the flame. • Atoms of the element being analysed that are present in the flame absorb some of the radiation. • The light beam is then passed through a filter to select the light of the chosen wavelength, and its intensity measured by an electronic detector. • The amount of light absorbed indicates the quantity of the element present in the original sample.
Interpreting Atomic Absorption Spectra… A batch of oysters was suspected of containing dangerous levels of lead. The following is an account of their analysis. One of the oysters was removed from its shell and chopped finely in a food processor. A 1.50g portion was heated on a hotplate with 10mL of nitric acid. The mixture was filtered and then sprayed into the flame of an atomic absorption spectrometer. A hollow cathode lamp that emitted light with a wavelength that is absorbed by lead atoms was in place. A significant amount of light was absorbed, indicating that there was lead in the oyster. To find the concentration of lead ions in the sample, the absorbance of different solutions containing known concentrations of lead ions was also measured. The results are graphed on the next slide. The recommended limit of lead in oysters for human consumption is 2.5ppm. Are these oysters fit to eat?
Interpreting Atomic Absorption Spectra cont… From the graph, the concentration of lead in the solution prepared from the oyster sample is 9.0ppm, which is equivalent to 9.0μg/ml-1. So, in the 10mL solution there is 9.0x101 = 90μg of lead. Since 90μg lead was present in 1.5og portion of oyster: Concentration in the oyster = 90μg/1.5g = 60μg g-1, or 60ppm Since the recommended limit of lead in oysters for human consumption is 2.5ppm, it would not be wise to eat these oysters.
UV-Visible Spectroscopy • UV-Visible spectroscopy makes use of the fact that many substances absorb light of characteristic wavelengths. • The wavelengths of the light absorbed by compounds can be used for their identification. • UV-Vis spectra arise because photons in this region of the electromagnetic spectrum have sufficient energy to promote electrons from low energy levels to higher energy levels. • Such electron transitions may occur in atoms, ions or molecules.
UV-Vis Spec cont… • When a substance absorbs visible light, it appears coloured. • The colour observed is the complement of the absorbed colour because this is what remains to reach our eyes.
UV-Vis Spec cont… • UV-Vis spectroscopy is mainly used for determining the concentration of a substance in a sample. • This procedure involved recording the spectrum of the pure substance and selecting a wavelength at which the substance absorbs strongly but other components in the sample do not. • The absorbance of the sample is then measured at this wavelength and compared to the absorbance of a series of standard solutions.
UV-Vis Spec Applications • Clinical analysis, measuring concentrations of specific substances in body fluids such as urine or blood. • Determining the amount of coloured dye in plastics. • Identifying the presence of metal ions. • Determining the levels of nutrients, additives and contaminants in water and foods. • In quantitative analysis of DNA and proteins in the field of molecular biology.
UV Vis Spectrophotometer • The radiation source provides ultraviolet and visible light of all wavelengths. • The monochromator selects a particular wavelength from those emitted by the source, and the detector measures the intensity of the light that passes through the sample.
UV-Vis Spectrophometer • The substance under investigation is in solution. • It is placed in the spectrophotometer in a special cell made up of quartz or fused silica transparent to UV and visible light. • With a special spectrophotometer, a reference reading is first taken with a cell containing only pure solvent. • This is used to compensate for any reflection, scattering or absorbance of the light by the cell and the solvent. • The reference cell is then replaced with a cell containing a solution of the sample. • The absorbance of the sample is found by comparing the two readings. • By measuring the absorbance at various wavelengths a graph, or spectrum, for the sample is obtained.
Interpreting UV-Visible Spectra • In a UV-Vis Spec, the absorbance of visible or UV light by a series of standard solutions is measured and a calibration graph is drawn. • By measuring the absorbance of the light of an unknown solution, its concentration can be found directly from the graph.
Worked Example for UV-Vis Spectra The concentration of iron in a sample of dam water was determined by UV spectroscopy. Iron present as Fe2+ ions was reacted to form an orange-yellow complex, iron(II)-1, 10-phenanthroline. The absorbance of a series of standards and a sample of dam water is shown in the table below. Determine the concentration of iron in the dam water in μg mL-1 (ppm).
Worked Example for UV-Vis Spectra The first step is to construct a calibration graph with the data from the table. The concentration of iron is plotted on the horizontal axis and the absorbance on the vertical axis.
Week 6, Lesson 1 Infrared Spectroscopy • Infrared radiation is lower in energy and of a longer wavelength than visible and ultraviolet light. • The energy from infrared radiation is not enough to promote electrons to a higher energy level, but it is enough to cause changes to the bonds in molecules. • Infrared spectroscopy exploits the fact that molecules are flexible structures that can bend and stretch. • This type of spectroscopy is a powerful analytical technique because apart from a few homonuclear molecules, all molecules absorb infrared radiation.
Infrared Spectroscopy cont… • For a molecule to absorb infrared radiation, the bending or stretching vibrations must change the overall dipole moment of the molecule.
Infrared Spectroscopy cont… • The range of energies absorbed depends on the strength of the bonds. • A single C-C bond absorbs lower energy infrared radiation than a double C=C bond. • The mass of the atoms also affects the energy absorbed; the higher the mass, the lower the energy of the radiation absorbed. • Frequency and wavelength are related by the equation c=λv. • Frequency is inversely proportional to wavelength. • In infrared spec. frequency is measured in wave number, which is the reciprocal of the wavelength (1/λ) and has units of cm-1.
Instrumentation • Features of a dispersive infrared spectrophotometer are: • A source of infrared radiation • A sample and reference cell or disc made out of NaCl, KBr or similar; glass and plastic cannot be used as they absorb IR radiation and so are opaque to IR radiation. • A wavelength selector • An infrared detector
Interpreting the Infrared Spectrum • Infrared spectroscopy is most important for the information it can give about the functional groups in a molecule. • This can be used to identify a known substance or clarify the structure of an unknown material. • The energy of the radiation absorbed and released depends on: • The kind of bonds in the molecule. • The environment or other bonds in the molecule
Quantitative Analysis • If one peak in the spectrum is selected, the absorbance increases as the concentration of the molecule in the sample increases. • This means IR spectroscopy can be used for quantitative analysis. • A strong sharp peak in the spectrum of the molecule is chosen. • A calibration curve can be constructed by using standards of known concentration.
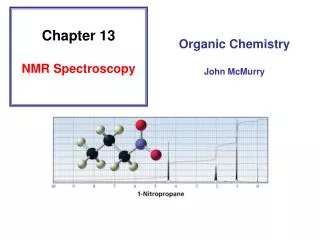
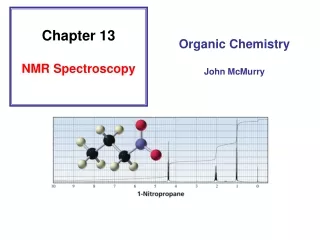
Week 6, Lesson 2 Nuclear Magnetic Resonance Spectroscopy Nuclear magnetic resonance spectroscopy [NMR] is a powerful qualitative tool for determining the structure of complex organic molecules. • NMR is concerned with the magnetic properties of certain nuclei, such as 1H1 and 13C6, which have an odd number of nucleons in their nucleus • The nuclei of these isotopes [1H1 and 13C6] act as tiny magnets and when placed in a powerful magnetic field, will align themselves, just like compass needles. • But if enough energy is applied to these aligned 1H and 13C nuclei, they will eventually “flip” their alignment to the opposite direction … this flipping is called resonance. • Proton-NMR and carbon-13 NMR deal with the absorption of radio-frequency [RF] electromagnetic energy to flip the polarity of the 1H1 or 13C6 nuclear magnets when they are in an external magnetic field. • The NMR spectrum is displayed as a peak on a graph, indicating when exactly the right magnetic field strength is being applied to allow the nuclei magnets to undergo resonance when exposed to a set RF energy.
NMR Spec cont… • the sample is spun at high speed inside a powerful magnetic field • an RF transmitter exposes the sample to a varying RF energy and an RF receiver detects the point at which the target nuclei undergo resonance
C-13 Nuclear Magnetic Resonance • C-13 Nuclear Magnetic Resonance • C-13 NMR deals with the absorption of radio-frequency energy to flip the polarity of the C-13 nuclear magnets when they are in an external magnetic field. • The C-13 NMR spectrum is displayed as a peak on a graph, indicating when exactly the right magnetic field strength is being applied to allow the C-13 nuclei magnets to undergo resonance when exposed to a set RF energy.
C-13 NMR • There are two “different” carbons in ethanol, one as part of a methyl side chain, the other has an OH attached … and so there are 2 peaks on the NMR spectrum • These “different” carbon atoms require different magnetic field strengths to set their C-13 nuclei magnets resonating
Effects of the Carbon Environment • For a given radio-frequency energy, each C-13 atom in a different molecular environment will need a slightly different magnetic field applied to it to keep it resonating, so the magnetic field strength needed gives us a useful guide to the atoms attached to the C atoms.
Setting the Standard • the horizontal scale on the NMR spectrum has a zero point, at the RHS of the scale. • Tetramethylsilane [TMS] is chosen as the zero point standard, because its 4 carbon atoms have only one C environment [ 1 strong peak]. • The horizontal -scale, measured in ppm is called the chemical shift.
Proton-NMR • Proton-NMR deals with the absorption of radio-frequency energy to flip the polarity of the 1H nuclear magnets when they are in an external magnetic field. • The proton-NMR spectrum is displayed as a peak on a graph, indicating when exactly the right magnetic field strength is being applied to allow the 1H nuclei magnets to undergo resonance when exposed to a set RF energy.
Proton NMR • there are two “different” types of hydrogen in CH3COOH, one in a methyl group, the other attached to the O atom… and so there are 2 peaks on the NMR spectrum • these “different” hydrogens atoms require different magnetic field strengths to set their 1H nuclei magnets resonating • the right hand peak is much taller as it represents 3 H atoms in the CH3 compared to only 1 H in the OH group.
Effect of the H atom’s Environment • For a given RF energy, each 1H atom with a different environment in a molecule will need a slightly different magnetic field applied to it to keep it resonating … so the magnetic field strength needed is a useful guide to the H atoms environment in the molecule.