Chapter 13 NMR Spectroscopy
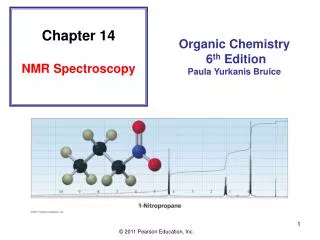
Chapter 13 NMR Spectroscopy. Organic Chemistry John McMurry. Nuclear Magnetic Resonance (NMR) Spectroscopy. Identify the carbon–hydrogen framework of an organic compound. 1 H NMR spectrum of 1-bromo-2,2-dimethylpropane. Certain nuclei such as 1 H, 13 C, 19 F, and 31 P have

Chapter 13 NMR Spectroscopy
E N D
Presentation Transcript
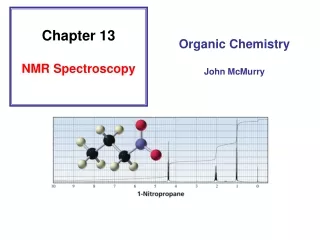
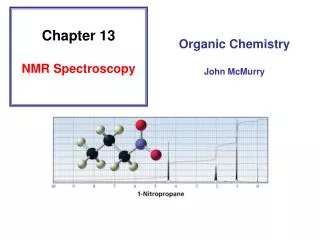
Chapter 13 NMR Spectroscopy Organic Chemistry John McMurry
Nuclear Magnetic Resonance (NMR) Spectroscopy Identify the carbon–hydrogen framework of an organic compound 1H NMR spectrum of 1-bromo-2,2-dimethylpropane
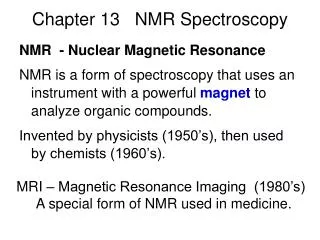
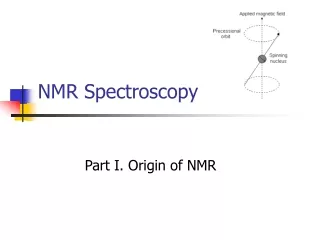
Certain nuclei such as 1H, 13C, 19F, and 31P have allowed spin states of +1/2 and –1/2; this property allows them to be studied by NMR
The spin state of a nucleus is affected by an applied magnetic field “+” “-” “+” “+” “-” “-”
An NMR Spectrometer Radiofrequency held constant
The energy difference between the two spin states depends on the strength of the magnetic field
spin flip: Nuclei are in resonance with applied electromagnetic radiation absorb DE a-spin states b-spin states release DE Overpopulates Higher E state System “relaxes” when rf pulse removed DE Signals detected by NMR
An NMR Spectrometer Magnetic field is varied Radiofrequency held constant
The Chemical Shift The reference point of an NMR spectrum is defined by the position of TMS (zero ppm) The chemical shift is a measure of how far the signal is from the reference signal The common scale for chemical shifts = d (ppm) distance downfield from TMS (Hz) d = operating frequency of the spectrometer (MHz)
The electrons surrounding a nucleus affect the effective magnetic field sensed by the nucleus Beffective = Bapplied - Blocal
Electron withdrawal causes NMR signals to appear at higher frequency (at larger d values)
Characteristic Values of Chemical Shifts
Chemically equivalent protons: protons in the same chemical environment Each set of chemically equivalent protons in a compound gives rise to a signal in an 1H NMR spectrum of that compound
The three methyl protons are chemically equivalent due to rotation about the C–C bond We see one signal for the methyl group in the 1H NMR spectrum
Chemically equivalent protons: protons in the same chemical environment Chemically non-equivalent protons: protons in the different chemical environment
Proton Equivalence • Unrelated protons • Homotopic protons • Enantiotopic protons • Diastereotopic Protons
Proton Equivalence • Unrelated protons Red H and green H are unrelated
Proton Equivalence • Homotopic protons The green H are homotopic to each other Are the red H are homotopic to each other?
Proton Equivalence • Enantiotopic protons
Proton Equivalence • Diastereotopic Protons
1H NMR spectrum of 1-bromo-2,2-dimethylpropane 9.0 2.0
Integration Line The area under each signal is proportional to the number of protons that give rise to that signal The height of each integration step is proportional to the area under a specific signal The integration tells us the relative number of protons that give rise to each signal, not absolute number
1H NMR spectrum of 1-bromo-2,2-dimethylpropane 9.0 2.0
1,1-Dichloroethane Splitting of the Signals
Splitting of the Signals • An 1H NMR signal is split into N + 1 peaks, where N is the number of equivalent protons bonded to adjacent carbons 1 equiv proton Adjacent carbons 3 equiv protons
Splitting of the Signals • Coupled protons split each other’s signal N + 1 These protons are coupled Why one proton splits signal of proton on adjacent carbon?
The ways in which the magnetic fields of three protons can be aligned H H H H H H H H H H H H
The ways in which the magnetic fields of three protons can be aligned H H H H H H H H H H H H
The ways in which the magnetic fields of three protons can be aligned H H H H H H H H H H H H
Coupling Constants The coupling constant (J) is the distance between two adjacent peaks of a split NMR signal in hertz Jab = Jba Coupled protons have the same coupling constant
Students: make a note of this correction! Splitting is observed if the protons are separated by three s bonds
Splitting of the Signals • An 1H NMR signal is split into N + 1 peaks, where N is the number of equivalent protons bonded to adjacent carbons • Coupled protons split each other’s signal • The number of peaks in a signal is called the multiplicity of the signal • The splitting of signals, caused by spin–spin coupling, occurs when different kinds of protons are close to one another
Diamagnetic Anisotropy The p electrons are less tightly held by the nuclei than are s electrons; they are more free to move in response to a magnetic field Causes unusual chemical shifts for hydrogen bonded to carbons that form p bonds
13C NMR Spectroscopy • The number of signals reflects the number of different kinds of carbons in a compound • The overall intensity of a 13C signal is about 6400 times less than the intensity of an 1H signal • The chemical shift ranges over 220 ppm • The reference compound is TMS
Proton-Decoupled 13C NMR of 2-Butanol