Download
1 / 16
160 likes | 515 Vues
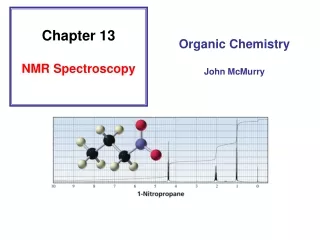
13.14 13 C NMR Spectroscopy. 1 H and 13 C NMR compared:. both give us information about the number of chemically nonequivalent nuclei (nonequivalent hydrogens or nonequivalent carbons) both give us information about the environment of the nuclei (hybridization state, attached atoms, etc.).

E N D
1H and 13C NMR compared: both give us information about the number of chemically nonequivalent nuclei (nonequivalent hydrogens or nonequivalent carbons) both give us information about the environment of the nuclei (hybridization state, attached atoms, etc.)
1H and 13C NMR compared: the signal for the NMR of a 13 C nucleus is 10-4 times weaker than the signal for a hydrogen nucleus a signal for a 13C nucleus is only about 1% as intense as that for 1H because of the magnetic properties of the nuclei, and at the "natural abundance" level only 1.1% of all the C atoms in a sample are 13C (most are 12C)
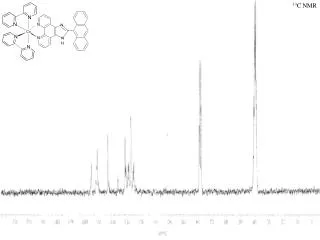
1H and 13C NMR compared: 13C signals are spread over a much wider range than 1H signals making it easier to identify and count individual nuclei Check the spectra on the next slides: Figure 13.20 (a) shows the 1H NMR spectrum of 1-chloropentane; Figure 13.20 (b) shows the 13C spectrum. It is much easier to identify the compound as 1-chloropentane by its 13C spectrum than by its 1H spectrum.
10.0 9.0 8.0 7.0 6.0 5.0 4.0 3.0 2.0 1.0 0 1H Figure 13.20(a) (page 511) CH3 ClCH2 ClCH2CH2CH2CH2CH3 Chemical shift (d, ppm)
200 180 160 140 120 100 80 60 40 20 0 13C Figure 13.20(b) (page 511)Note: in these spectra the peak intensities are not exactly proportional to the number of carbon atoms. a separate, distinct peak appears for each of the 5 carbons ClCH2CH2CH2CH2CH3 CDCl3 Chemical shift (d, ppm)
13.1513C Chemical Shifts are measured in ppm (d)from the carbons of TMS
13C Chemical shifts are most affected by: • hybridization state of carbon • electronegativity of groups attached to carbon
Examples (chemical shifts in ppm from TMS) sp3 hybridized carbon is more shielded than sp2 23 138
OH O Examples (chemical shifts in ppm from TMS) sp3 hybridized carbon is more shielded than sp2 61 202
OH Examples (chemical shifts in ppm from TMS) an electronegative atom deshields the carbon to which it is attached 23 61
O Examples (chemical shifts in ppm from TMS) an electronegative atom deshields the carbon to which it is attached 138 202
Table 13.3 (p 513) Type of carbon Chemical shift (d),ppm RCH3 0-35 R2CH2 15-40 R3CH 25-50 R4C 30-40
RC CR R2C CR2 Table 13.3 (p 513) Type of carbon Chemical shift (d),ppm Type of carbon Chemical shift (d),ppm RCH3 0-35 65-90 R2CH2 15-40 100-150 R3CH 25-50 110-175 R4C 30-40
Table 13.3 (p 513) Type of carbon Chemical shift (d),ppm RCH2Br 20-40 RCH2Cl 25-50 35-50 RCH2NH2 50-65 RCH2OH RCH2OR 50-65
O O Table 13.3 (p 513) Type of carbon Chemical shift (d),ppm Type of carbon Chemical shift (d),ppm RCH2Br 20-40 RCOR 160-185 RCH2Cl 25-50 35-50 RCH2NH2 50-65 RCH2OH RCR 190-220 RCH2OR 50-65