NMR SPECTROSCOPY
NMR SPECTROSCOPY. B.Sc III Organic Chemistry By:- Dr. Sadhana Verma Associate Professor P.G.G.C.G-11. NMR SPECTROSCOPY. Nuclear magnetic resonance spectroscopy has become a very powerful tool for structure elucidation to an organic chemist.

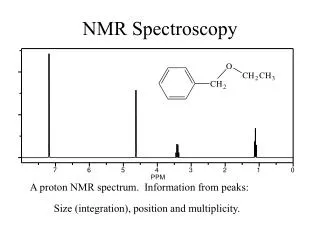
NMR SPECTROSCOPY
E N D
Presentation Transcript
NMRSPECTROSCOPY B.Sc III Organic Chemistry By:- Dr. SadhanaVerma Associate Professor P.G.G.C.G-11
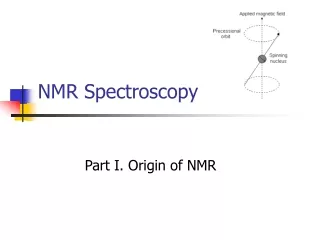
NMR SPECTROSCOPY • Nuclear magnetic resonance spectroscopy has become a very powerful tool for structure elucidation to an organic chemist. • This technique is based on transitions between nuclear spin states by absorption of electromagnetic radiations in the radiofrequency region of roughly 4 to 900 MHz by certain organic molecules when they are placed in a strong magnetic field. • E. Bloch and F. Purcell (1952) were awarded nobel prize for demonstrating the NMR effect in 1946.
Nuclear Spin States • An electron has a spin quantum number of 1/2 with allowed values of +1/2 and -1/2. • This spinning charge has an associated magnetic field. • In effect, an electron behaves as if it is a tiny bar magnet and has what is called a magnetic moment. • The same effect holds for certain atomic nuclei. • Any atomic nucleus that has an odd mass number, an odd atomic number, or both, also has a spin and a resulting nuclear magnetic moment. • The allowed nuclear spin states are determined by the spin quantum number, I, of the nucleus given by the formula 2I+1
Introduction to NMR Spectroscopy • When a charged particle such as a proton spins on its axis, it creates a magnetic field. Thus, the nucleus can be considered to be a tiny bar magnet. • Normally, these tiny bar magnets are randomly oriented in space. However, in the presence of a magnetic field B0, they are oriented with or against this applied field. More nuclei are oriented with the applied field because this arrangement is lower in energy. • The energy difference between these two states is very small (<0.1 cal).
Nuclear Spins in B0 • for 1H and 13C, only two orientations are allowed.
Nuclear Magnetic Resonance • (a) Precession and (b) after absorption of electromagnetic radiation.
Nuclear Magnetic Resonance • Resonance: In NMR spectroscopy, resonance is the absorption of energy by a precessing nucleus and the resulting “flip” of its nuclear spin from a lower energy state to a higher energy state. • The precessing spins induce an oscillating magnetic field that is recorded as a signal by the instrument. • Signal: A recording in an NMR spectrum of a nuclear magnetic resonance.
Nuclear Spin in B0 • The energy difference between allowed spin states increases linearly with applied field strength. • Values shown here are for 1H nuclei.
E and Magnet Strength • Energy difference is proportional to the magnetic field strength. • E = h = h B0 The Larmor Equation2 • Gyromagnetic ratio, , is a constant for each nucleus (26,753 s-1gauss-1 for H).
POPULATION AND SIGNAL STRENGTH The strength of the NMR signal depends on the Population Difference of the two spin states For a net positive signal there must be an excess of spins in the lower state. induced emission resonance excess population Saturation = equal populations = no signal
Relaxation processes • In actual case saturation stage is never reached because higher energy nuclei are constantly returning to the lower energy state by two radiationless processes called • Spin-spin relaxation • Spin-lattice relaxation
SPIN-LATTICE Relaxation T1 relaxation is sometimes called spin-lattice relaxation. In this type of relaxation the energy lost as the nucleus returns to the lower energy state is transferred to the molecule in the form of heat. This means that the total number of nuclei in the excited state decreases.
SPIN-SPIN Relaxation T2 relaxation is commonly referred as spin-spin relaxation. In this type of relaxation the energy released when a nucleus makes the transition from high to low energy state is absorbed by another nucleus. This allows the other nucleus to move from low energy to high. In this case the total number of nuclei in the excited state doesn’t change. Short relaxation times result in broad signals. This is a result of the Heisenberg uncertainty principle. The shorter the time frame for observation the more uncertainty exists in the frequency. Longer relaxation times then produce narrower signals. .
NMR Spectrometer • Essentials of an NMR spectrometer are a powerful magnet, a radio-frequency generator, and a radio-frequency detector. • The sample is dissolved in a solvent, most commonly CDCl3 or D2O, and placed in a sample tube which is then suspended in the magnetic field and set spinning. • Using a Fourier transform NMR (FT-NMR) spectrometer, a spectrum can be recorded in about 2 seconds.
A Simplified 60 MHzNMR Spectrometer hn RF (60 MHz) Oscillator RF Detector absorption signal Recorder Transmitter Receiver MAGNET MAGNET ~ 1.41 Tesla (+/-) a few ppm N S Probe
CONTINUOUS WAVE (CW) METHOD THE OLDER, CLASSICAL METHOD The magnetic field is “scanned” from a low field strength to a higher field strength while a constant beam of radiofrequency (continuous wave) is supplied at a fixed frequency (say 100 MHz). Using this method, it requires several minutes to plot an NMR spectrum. SLOW, HIGH NOISE LEVEL
FOURIER TRANSFORM A mathematical technique that resolves a complex FID signal into the individual frequencies that add together to make it. ( Details not given here. ) DOMAINS ARE MATHEMATICAL TERMS converted to TIME DOMAIN FREQUENCY DOMAIN FID NMR SPECTRUM FT-NMR computer n1 + n2 + n3 + ...... COMPLEX SIGNAL Fourier Transform individual frequencies a mixture of frequencies decaying (with time) converted to a spectrum
PULSED FOURIER TRANSFORM (FT) METHOD FAST LOW NOISE THE NEWER COMPUTER-BASED METHOD Most protons relax (decay) from their excited states very quickly (within a second). The excitation pulse, the data collection (FID), and the computer-driven Fourier Transform (FT) take only a few seconds. The pulse and data collection cycles may be repeated every few seconds. Many repetitions can be performed in a very short time, leading to improved signal …..
NMR Signals • The number of signals shows how many different kinds of protons are present. • The location of the signals shows how shielded or deshielded the proton is. • The intensity of the signal shows the number of protons of that type. • Signal splitting shows the number of protons on adjacent atoms. => Chapter 13
1H NMR : Number of Signals • Equivalent hydrogens:Hydrogens that have the same chemical environment The number of NMR signals ~ the number of different types of 1Hs. • Equivalent 1Hs give the same NMR signal.
Classification of Protons • If replacement of one hydrogen at a time in separate models creates enantiomers, the hydrogens are enantiotopic. Enantiotopic protons have the same chemical shifts. If replacement of hydrogens in separate models creates diastereomers, the hydrogens are diastereotopic Diastereotopic protons have different chemical shifts
1H NMR: Position of Signals (Chemical shift) • In the vicinity of the nucleus, the magnetic field generated by the circulating electron decreases the external magnetic field that the proton “feels”. • Since the electron experiences a lower magnetic field strength, it needs a lower frequency to achieve resonance. Lower frequency is to the right in an NMR spectrum, toward a lower chemical shift, so shielding shifts the absorption upfield.
Tetramethylsilane: PEAKS ARE MEASURED RELATIVE TO TMS • TMS has following advantages as the reference compound: • 1. It is chemically inert and non-toxic. • 2. It is volatile (b.pt 270c) and soluble in most organic solvents. • 3. It gives a single sharp peak as it has 12equivalent hydrogens. . 4. Since silicon is less electronegative than carbon, TMS protons are highly shielded. Signal defined as zero. • 5. Organic protons absorb downfield (to the left) of the TMS signal. =>
CHEMICAL SHIFT • NMR absorptions generally appear as sharp peaks. • Increasing chemical shift is plotted from left to right. • Most protons absorb between 0-10 ppm. • The terms “upfield” and “downfield” describe the relative location of peaks. Upfield means to the right. Downfield means to the left. • NMR absorptions are measured relative to the position of a reference peak at 0 ppm on the d scale due to tetramethylsilane (TMS). TMS is a volatile inert compound that gives a single peak upfield from typical NMR absorptions.
THE CHEMICAL SHIFT The shifts from TMS in Hz are bigger in higher field instruments (300 MHz, 500 MHz) than they are in the lower field instruments (100 MHz, 60 MHz). We can adjust the shift to a field-independent value, the “chemical shift” in the following way: parts per million shift in Hz chemical shift = d = = ppm spectrometer frequency in MHz This division gives a number independent of the instrument used. A particular proton in a given molecule will always come at the same chemical shift (constant value).
NMR signal Intensity of signal (photon quantity) Spin flip energy (photon energy) The NMR Spectrum • Spectrum = plot of photon energy versus photon quantity Deshielded (downfield) Low magnetic field strength Shielded (upfield) High magnetic field strength
Factors affecting Chemical Shift Three major factors account for the resonance positions (on the ppm scale) of most protons. 1. Deshielding by electronegative elements. 2. Anisotropic fields usually due to pi-bonded electrons in the molecule. 3. Deshielding due to hydrogen bonding. We will discuss these factors in the sections that follow.
1. DESHIELDING BY AN ELECTRONEGATIVE ELEMENT d- d+ Chlorine “deshields” the proton, that is, it takes valence electron density away from carbon, which in turn takes more density from hydrogen deshielding the proton. Cl C H d- d+ electronegative element NMR CHART “deshielded“ protons appear at low field highly shielded protons appear at high field deshielding moves proton resonance to lower field
Electronegativity Dependence of Chemical Shift Dependence of the Chemical Shift of CH3X on the Element X Compound CH3X CH3F CH3OH CH3Cl CH3Br CH3I CH4 (CH3)4Si Element X F O Cl Br I H Si Electronegativity of X 4.0 3.5 3.1 2.8 2.5 2.1 1.8 Chemical shift d 4.26 3.40 3.05 2.68 2.16 0.23 0 most deshielded TMS deshielding increases with the electronegativity of atom X
2. ANISOTROPIC EFFECTS DUE TO THE PRESENCE OF PI BONDS Anisotropy refers to the dissimilar electron density in all directions.The presence of a nearby pi bond or pi system greatly affects the chemical shift. .
Acetylenic Protons, 2.5 In a magnetic field, the electrons of a carbon-carbon triple bond are induced to circulate, but in this case the induced magnetic field opposes the applied magnetic field (B0).Thus, the proton feels a weaker magnetic field, so a lower frequency is needed for resonance. The nucleus is shielded and the absorption is upfield. => Chapter 13
Vinyl Protons, 5-6 In a magnetic field, the loosely held electrons of the double bond create a magnetic field that reinforces the applied field in the vicinity of the protons.The protons now feel a stronger magnetic field, and require a higher frequency for resonance. Thus the protons are deshielded => Chapter 13
7-8 fields add together
HYDROGEN BONDING - DESHIELDS The chemical shift depends on how much hydrogen bonding is taking place. Alcohols vary in chemical shift from 0.5 ppm (free OH) to about 5.0 ppm (lots of H bonding). Hydrogen bonding lengthens the O-H bond and reduces the valence electron density around the proton - it is deshielded and shifted downfield in the NMR spectrum.
. Chemical Shift Values • Protons in a given environment absorb in a predictable region in an NMR spectrum.
INTENSITY -INTEGRATION OF A PEAK Not only does each different type of hydrogen give a distinct peak in the NMR spectrum, but we can also tell the relative numbers of each type of hydrogen by a process called integration. Integration = determination of the area under a peak The area under a peak is proportional to the number of hydrogens that generate the peak.
Signal Areas • Relative areas of signals are proportional to the number of H giving rise to each signal, Modern NMR spectrometers electronically integrate and record the relative area of each signal.
SPIN-SPIN SPLITTING • Often a group of hydrogens will appear as a multiplet • rather than as a single peak. • This happens because of interaction with neighboring • hydrogens and is called SPIN-SPIN SPLITTING. • . Nonequivalent protons on adjacent carbons have magnetic fields that may align with or oppose the external field. • This magnetic coupling causes the proton to absorb slightly downfield when the external field is reinforced and slightly upfield when the external field is opposed. • All possibilities exist, so signal is split : .
Signal Splitting; the (n + 1) Rule • Peak:The units into which an NMR signal is split; doublet, triplet, quartet, multiplet, etc. • Signal splitting:Splitting of an NMR signal into a set of peaks by the influence of neighboring nonequivalent hydrogens. • (n + 1) rule:If a hydrogen has nhydrogens nonequivalent to it but equivalent among themselves on the same or adjacent atom(s), its 1H-NMR signal is split into (n + 1) peaks.
Signal Splitting (n + 1) • 1H-NMR spectrum of 1,1-dichloroethane.
THE CHEMICAL SHIFT OF PROTON HA IS AFFECTED BY THE SPIN OF ITS NEIGHBORS aligned with Bo opposed to Bo +1/2 -1/2 50 % of molecules 50 % of molecules H H H H A A C C C C Bo downfield upfield neighbor aligned neighbor opposed At any given time about half of the molecules in solution will have spin +1/2 and the other half will have spin -1/2.
Doublet: One Adjacent Proton • Hb can feel the alignment of the adjacent proton Ha. • When Ha is aligned with the magnetic field, Hb will be deshielded. • When Ha is aligned with the magnetic field, Hb will be shielded. • The signal is split in two and it is called a doublet. Chapter 13
Triplet: Two Adjacent Protons • When both Hb are aligned with the magnetic field, Ha will be deshielded. • When both Hb are aligned with the magnetic field, Ha will be deshielded. • It is more likely that one Hb will be aligned with the field and the other Hb against the field. The signal will be at its normal position. • The signal is split in three and it is called a triplet. Chapter 13
Origins of Signal Splitting • The origins of signal splitting patterns. Each arrow represents an Hb nuclear spin orientation.
Rules for splitting of proton signals • Equivalent protons do not split each other. • Protons bonded to the same carbon will split each other if they are nonequivalent. • Protons on adjacent carbons normally will split each other. • Protons separated by four or more bonds will not split each other. Chapter 13
The interior entries are the sums of the two numbers immediately above. PASCAL’S TRIANGLE (Intensities of multiplet peaks) 1 singlet 1 1 doublet 1 2 1 triplet 1 3 3 1 quartet 1 4 6 4 1 quintet 1 5 10 10 5 1 sextet 1 6 15 20 15 6 1 septet 1 7 21 35 35 21 7 1 octet
THE COUPLING CONSTANT J J J J J J The coupling constant J is the distance (measured in Hz) between the peaks in a multiplet. Not dependent on strength of the external field J is a measure of the amount of interaction between the two sets of hydrogens creating the multiplet.
NOTATION FOR COUPLING CONSTANTS The most commonly encountered type of coupling is between hydrogens on adjacent carbon atoms. This is sometimes called vicinal coupling. It is designated 3J since three bonds intervene between the two hydrogens. 3J Another type of coupling that can also occur in special cases is 2J or geminal coupling ( most often 2J = 0 ) Geminal coupling does not occur when the two hydrogens are equivalent due to rotations around the other two bonds. 2J
SOME REPRESENTATIVE COUPLING CONSTANTS 6 to 8 Hz three bond 3J vicinal 11 to 18 Hz three bond 3J trans 6 to 15 Hz three bond 3J cis 0 to 5 Hz two bond 2J geminal Hax,Hax = 8 to 14 Hax,Heq = 0 to 7 three bond 3J Heq,Heq = 0 to 5