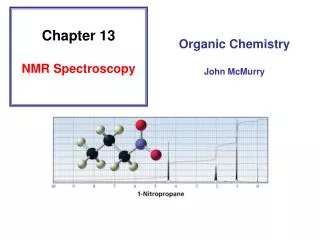
Chapter 13 - Spectroscopy
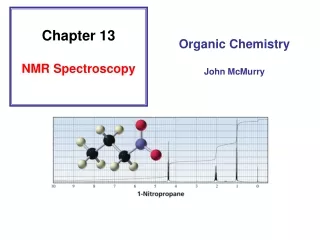
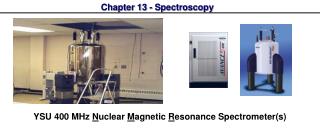
Chapter 13 - Spectroscopy. YSU 400 MHz N uclear M agnetic R esonance Spectrometer(s). Techniques used to find structures of organic molecules. NMR spectroscopy : Based on the response of magnetic nuclei to an external magnetic field and an energy source (Radio frequency)

Chapter 13 - Spectroscopy
E N D
Presentation Transcript
Chapter 13 - Spectroscopy YSU 400 MHz Nuclear Magnetic Resonance Spectrometer(s)
Techniques used to find structures of organic molecules NMR spectroscopy: Based on the response of magnetic nuclei to an external magnetic field and an energy source (Radio frequency) IR spectroscopy: Response of bonds within organic molecules to externally applied Infra Red light UV/Vis spectroscopy: Response of electrons within bonds to externally applied UV or Visible light Mass spectrometry: Response of molecules to being bombarded with high energy particles such as electrons
13.2 Physics Concepts • E = hni.e. Energy of the radiation is directly proportional to its frequency (n = Planck’s constant) • = c/li.e. Frequency of the radiation is inversely proportional to its wavelength (c = speed of light) E = hc/l i.e. Energy of the radiation is inversely proportional to its wavelength Take home :Longer wavelength, lower energy Higher frequency, higher energy
13.3 Introduction to 1H NMR – Nuclear Spin Nuclear spins of protons (1H nucleus) Figure 13.3
Energy difference between states increases with field strength (Fig. 13.4)
Schematic diagram of a nuclear magnetic resonance spectrometer
Basic operation of a Fourier Transform (FT) NMR Instrument (Fig. 13.5)
13.4 NMR Spectrum Characteristics – Chemical Shift Position of signal is the chemical shift downfield upfield downfield upfield
13.4 NMR Spectrum Characteristics – Chemical Shift Chemical shift (d) = position of signal – position of TMS peak x 106 spectrometer frequency Enables us to use same scale for different size spectrometers (60 MHz, 400 MHz, 850 MHz, etc.) TMS = (CH3)4Si, signal appears at 0 Hz on spectrum, therefore used as reference Chemical shifts are reported as ppm (parts per million) relative to TMS and usually occur in the 0-12 ppm range for 1H spectra
13.5 Effect of molecular structure on 1H Chemical Shift CH3F CH3OCH3 (CH3)3NCH3CH3 4.3 3.2 2.2 0.9 i.e. electronegativity of other atoms plays a role in shift ~0.9 ppm
13.5 Effect of structure on 1H Chemical Shift 7.3 5.3 0.9 Pi electrons reinforce external field and signals show downfield
~0.9 ppm “R3C-H – alkyl” ~5.3 ppm “C=C-H alkene” ~7.3 ppm “Ar-Hbenzene”
13.5 Effect of structure on 1H Chemical Shift Spectra typically have multiple signals the number depending on the number of unique types of protons
13.5 Typical 1H NMR Spectra Simple alkane protons – R2CH2 From spectroscopy sheet – chemical shift ~ 0.9-1.8 ppm
13.5 Typical 1H NMR Spectra Ether protons -O-C-H From spectroscopy sheet – chemical shift ~ 3.3-3.7 ppm
13.5 Typical 1H NMR Spectra Two types of ether protons -O-C-H From spectroscopy sheet – chemical shift ~ 3.3-3.7 ppm CH2 further downfield (two neighbouring O atoms)
13.5 Typical 1H NMR Spectra Aldehyde proton -CHO From spectroscopy sheet – chemical shift ~ 9-10 ppm 3 types of Ar-H proton – chemical shift ~6.5-8.5 ppm
13.5 Typical 1H NMR Spectra Carboxylic acid proton -CO2H From spectroscopy sheet – chemical shift ~ 10-13 ppm 3 types of Ar-H proton – chemical shift ~6.5-8.5 ppm
13.6 Integration – Ratio of different types of H 5 1 Lines on spectra are curves Areas underneath each curve give a reliable ratio of the different numbers of each type of proton
13.6 Integration – Ratio of different types of H 3 3 2 Areas are given as a ratio, not an absolute number
13.7 Spin-Spin Splitting – Effect of neighbouring H on shape
13.7 Spin-Spin Splitting – Effect of neighbouring H on shape
13.7 Spin-Spin Splitting – Effect of neighbouring H on shape
13.7 Spin-Spin Splitting – Effect of neighbouring H on shape General rule for splitting patterns For simple cases, multiplicity for H = n + 1 Where n = number of neighbouring protons i.e 1 neighbour, signal appears as a doublet 2 neighbours, signal appears as a triplet 3 neighbours, signal appears as a quartet 4 neigbours, signal appears as a quintet, etc. Complex splitting patterns are referred to as multiplets
13.7-13.10 Basis of Splitting Patterns For red H : neighbouring H (blue) has two possible alignments, either with, or against, the external field (Ho). This effects the local magnetic environment around the red H and thus there are two slightly different frequencies (and thus chemical shifts) at which the red H resonates. Same applies to the blue H.
13.7-13.10 Basis of Splitting Patterns Red H will be a triplet Blue H’s will be a doublet
13.7-13.10 Basis of Splitting Patterns Red H will be split into a quartet, blue H’s will be split into a doublet
13.7-13.10 Basis of Splitting Patterns - Coupling Constants Gaps between lines (in Hz) will be the same for adjacent protons (here ~7.4 Hz). This is the coupling constant.
Using CouplingConstants CH3CH2 but which one? CH3CH2O Find J and match signals
CouplingConstants – Nonequivalent Neighbours If nonequivalent neighbours have same J value then n+1 applies for signal CH3CH2 CH2CH2Cl CH3CH2 CH3CH2CH2
13.11 Complex Splitting Patterns When nonequivalent neighbours have different J values then n+1 does not apply for signal Figure 13.20 Generally for alkene protons: J trans > J cis
13.12 1H NMR Spectra of Alcohols Figure 13.21 Acidic protons exchange with any H2O in sample
Glycosyl amide structure from NMR - NOESY N-H N-H YSU
Glycosyl amide structure from 2-D NMR - COSY H-2 H-4 H-3 H-5 N-H H1, H2, H3, and H4 hard to distinguish just from coupling constants (all t, J~9 Hz) David Temelkoff YSU
13.14 13C NMR Spectroscopy Figure 13.23
13.14 13C NMR Spectroscopy • Carbon 13 isotope and not 12C is observed in NMR • 13C very low abundance (<1%), integration not useful • Spectra usually “decoupled” and signals are singlets • Number of distinct signals indicates distinct carbons • Same ideas about shielding/deshielding apply • Spectra often measured in CDCl3 and referenced to • either the C in TMS (0 ppm) or the C in CDCl3, which shows • as a triplet at 77.0 ppm
13.15 13C NMR Chemical Shifts (see Sheet) 13C NMR (ppm) 21, 52, 121, 122, 120, 126, 132, 134, 148, 168, 169
13.15 13C NMR Chemical Shifts (see Sheet) 13C NMR (ppm) 23, 28, 32, 128, 151, 197