Download
1 / 73
780 likes | 1.32k Vues
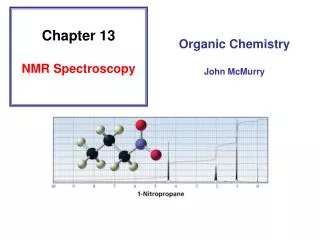
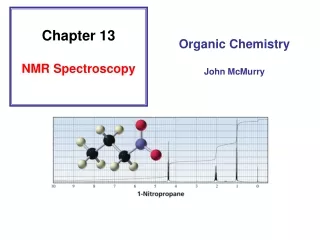
Chapter 13: Spectroscopy Methods of structure determination • Nuclear Magnetic Resonances (NMR) Spectroscopy (Sections 13.3-13.19) • Infrared (IR) Spectroscopy (Sections 13.20-13.22) • Ultraviolet-visible (UV-Vis) Spectroscopy (Section 13.23)

E N D
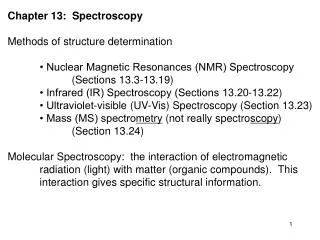
Chapter 13: Spectroscopy Methods of structure determination • Nuclear Magnetic Resonances (NMR) Spectroscopy (Sections 13.3-13.19) • Infrared (IR) Spectroscopy (Sections 13.20-13.22) • Ultraviolet-visible (UV-Vis) Spectroscopy (Section 13.23) • Mass (MS) spectrometry (not really spectroscopy) (Section 13.24) Molecular Spectroscopy: the interaction of electromagnetic radiation (light) with matter (organic compounds). This interaction gives specific structural information.
13.24: Mass Spectrometry: molecular weight of the sample formula The mass spectrometer gives the mass to charge ratio (m/z), therefore the sample (analyte) must be an ion. Mass spectrometry is a gas phase technique- the sample must be “vaporized.” Electron-impact ionization proton 1.00728 u neutron 1.00866 u electron 0.00055 u
B= magnetic field strength r = radius of the analyzer tube V= voltage (accelerator plate) mass m charge z B2 r2 2V = = Magnetic Field, Bo The Mass Spectrometer
Exact Masses of Common Natural Isotopes Isotope mass natural abundance 1H 1.00782 99.985 2H 2.01410 0.015 12C 12.0000 98.892 13C 13.0033 1.108 (1.11%) 14N 14.00307 99.634 15N 15.00010 0.366 (0.38%) 16O 15.99491 99.763 17O 16.99913 0.037 (0.04%) 18O 17.99916 0.200 (0.20%) Isotope mass natural abundance 19F 18.99840 100.00 35Cl 34.96885 75.77 37Cl 36.96590 24.23 (32.5%) 79Br 78.91839 50.69 81Br 80.91642 49.31 (98%) 127I 126.90447 100.00
Molecular Ion (parent ion, M) = molecular mass of the analyte; sample minus an electron Base peak- largest (most abundant) peak in a mass spectrum; arbitrarily assigned a relative abundance of 100%. m/z=78 (M+) (100%) m/z=79 (M+1) (~ 6.6% of M+)
The radical cation (M+•) is unstable and will fragment into smaller ions m/z=15 m/z=16 (M+) Relative abundance (%) m/z=17 (M+1) m/z=14 m/z m/z=29 m/z=44 (M) m/z=43 Relative abundance (%) m/z=15 m/z=45 (M+1) m/z
35Cl 34.96885 75.77 37Cl 36.96590 24.23 (32.5%) m/z=112 (M+) m/z=114 (M+ +2) m/z=113 (M+ +1) m/z=77 m/z=115 (M+ +3) m/z m/z=77 79Br 78.91839 50.69 81Br 80.91642 49.31 (98%) m/z=158 (M+ +2) m/z=156 (M+) m/z=159 (M+ +3) m/z=157 (M+ +1) m/z
Mass spectra can be quite complicated and interpretation difficult. Some functional groups have characteristic fragmentation It is difficult to assign an entire structure based only on the mass spectrum. However, the mass spectrum gives the mass and formula of the sample, which is very important information. To obtain the formula, the molecular ion must be observed. Soft ionization techniques Methods have been developed to get large molecules such as polymers and biological macromolecules (proteins, peptides, nucleic acids) into the vapor phase
13.25: Molecular Formula as a Clue to Structure Nitrogen rule: In general, “small” organic molecules with an odd mass must have an odd number of nitrogens. Organic molecules with an even mass have zero or an even number of nitrogens If the mass can be determined accurately enough, then the molecular formula can be determined (high-resolution mass spectrometry) Information can be obtained from the molecular formula: Degrees of unsaturation: the number of rings and/or -bonds in a molecule (Index of Hydrogen Deficiency)
Degrees of unsaturation saturated hydrocarbon CnH2n+2 cycloalkane (1 ring) CnH2n alkene (1 p-bond) CnH2n alkyne (2 p-bonds) CnH2n-2 For each ring or p-bond, -2H from the formula of the saturated alkane • C6H14 • C6H6 • H8 • C6H14 • C6H12 • H2 Hydrogen Deficiency 8 =4 1 2 2 =1 1 2 Degrees of Unsaturation
Correction for other elements: For Group VII elements (halogens): subtract 1H from the H-deficiency for each halogen, For Group VI elements (O and S): No correction is needed For Group V elements (N and P): add 1H to the H-deficiency for each N or P C10H14N2 C12H4O2Cl4
13.1: Principles of molecular spectroscopy: Electromagnetic radiation organic molecule (ground state) light h organic molecule (excited state) relaxation organic molecule (ground state) + h Electromagnetic radiation has the properties of a particle (photon) and a wave. • = distance of one wave • = frequency: waves per unit time (sec-1, Hz) c = speed of light (3.0 x 10⁸ m • sec-1) • h = Plank’s constant (6.63 x 10⁻³⁴ J • sec)
Quantum: the energy of a photon E = h = E = c h•c E E (cm) long low low short high high Wavelength () Frequency () Energy (E)
13.2: Principles of molecular spectroscopy: Quantized Energy Levels molecules have discrete energy levels (no continuum between levels) A molecule absorbs electromagnetic radiation when the energy of photon corresponds to the difference in energy between two states
organic molecule (ground state) light h organic molecule (excited state) relaxation organic molecule (ground state) + h UV-Vis: valance electron transitions - gives information about p-bonds and conjugated systems Infrared: molecular vibrations (stretches, bends) - identify functional groups Radiowaves: nuclear spin in a magnetic field (NMR) - gives a map of the H and C framework
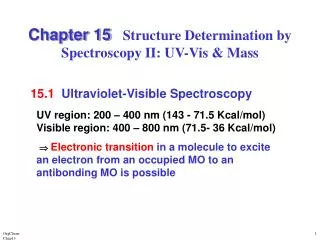
13.23 Ultraviolet-Visible (UV-Vis) Spectroscopy UV Vis 200 800 nm 400 Recall bonding of a -bond from Chapter 10.16
p-molecular orbitals of butadiene 4: 3 Nodes 0 bonding interactions 3 antibonding interactions ANTIBONDING MO 3: 2 Nodes 1 bonding interactions 2 antibonding interactions ANTIBONDING MO 2: 1 Nodes 2 bonding interactions 1 antibonding interactions BONDING MO 1: 0 Nodes 3 bonding interactions 0 antibonding interactions BONDING MO y2 is the Highest Occupied Molecular Orbital (HOMO) y3 is the Lowest Unoccupied Molecular Orbital (LUMO)
UV-Vis light causes electrons in lower energy molecular orbitals to be promoted to higher energy molecular orbitals. HOMO LUMO Chromophore: light absorbing portion of a molecule
Molecules with extended conjugation move toward the visible region Color of absorbed light Color observed l violet 400 nm yellow blue 450 orange blue-green 500 red yellow-green 530 red-violet yellow 550 violet orange 600 blue-green red 700 green
Many natural pigments have conjugated systems Chlorophyll anthocyanin -carotene lycopene
Chromophore: light absorbing portion of a molecule Beer’s Law: There is a linear relationship between absorbance and concentration A = c l A = absorbance c = concentration (M, mol/L) l = sample path length (cm) = molar absorptivity (extinction coefficient) a proportionality constant for a specific absorbance of a substance
13.20: Introduction to Infrared Spectroscopy (cm) 1 l E a _ • is expressed as n (wavenumber), reciprocal cm (cm-1) _ _ 1 l n = therefore E a n IR radiation causes changes in a molecular vibrations
Stretch: change in bond length http://www2.chem.ucalgary.ca/Flash/photon.html Symmetric stretch Antisymmetric stretch Bend: change in bond angle wagging twisting scissoring rocking in-plane bend out-of-plane bend Animation of bond streches and bends: http://wetche.cmbi.ru.nl//organic/vibr/methamjm.html
Bond Stretch: Hooke’s Law _ E a n a f Hooke’s law simulation: http://www2.chem.ucalgary.ca/Flash/hooke.html
13.21 Infrared Spectra Interpretation of an Infrared Spectra: Organic molecules contain many atoms. As a result, there are many stretching and bending modes- IR spectra have many absorption bands Four distinct regions of an IR spectra C-H O-H N-H C=C C=O CC CN
Fingerprint region (600 - 1500 cm-1)- low energy single bond stretching and bending modes. The fingerprint region is unique for any given organic compound. However, there are few diagnostic absorptions. Double-bond regions (1500 - 2000 cm-1) C=C 1620 - 1680 cm-1 C=O 1680 - 1790 cm-1 Triple-bond region: (2000 - 2500 cm-1) CC 2100 - 2200 cm-1 (weak, often not observed) CN 2240 - 2280 cm-1 X-H Single-bond region (2500 - 4000 cm-1) O-H 3200 - 3600 cm-1 (broad) CO-OH 2500-3600 cm-1 (very broad) N-H 3350 - 3500 cm-1 C-H 2800 - 3300 cm-1 sp3 -C-H 2850 - 2950 cm-1 sp2 =C-H 3000 - 3100 cm-1 sp C-H 3310 - 3320 cm-1
13.22 Characteristic Absorption Frequencies Table 13.4, p. 578 Alkenes =C-H 3020 - 3100 cm-1 medium - strong C=C 1640 - 1680 cm-1 medium Aromatic =C-H 3030 cm-1 strong C=C 1450 - 1600 cm-1 strong Alkynes C-H 3300 cm-1 strong CC 2100-2260 cm-1 weak - medium Alcohols C-O 1050 - 1150 cm-1 strong O-H 3400 - 3600 cm-1 strong and broad Amines C-N 1030 - 1230 cm-1 medium N-H 3300 - 3500 cm-1 medium Carbonyl C=O 1670 - 1780 cm-1 strong Carboxylic acids O-H 2500 - 3500 cm-1 strong and very broad Nitrile CN 2240 - 2280 cm-1 weak-medium
=C-H % transmittance % transmittance C=C C-H C-H hexane cm-1 cm-1 CC CC % transmittance % transmittance C-H C-H C-H cm-1 cm-1
CH3(CH2)4CH2OH CN C-H H3C(H2C)4CH2CN C-O C-H O-H CH3(CH2)4CH2NH-CH3 CH3(CH2)4CH2NH2 N-H N-H C-H C-H
O-H C=O 1705 cm-1 C=O 1710 cm-1 C=O 1730 cm-1 C-H C=O 1715 cm-1 C-H
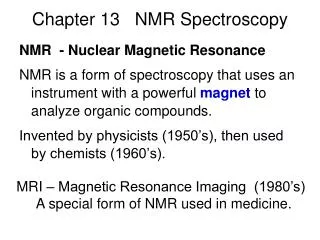
13.3: Introduction to 1H NMR direct observation of the H’s of a molecules Nuclei are positively charged and spin on an axis; they create a tiny magnetic field Not all nuclei are suitable for NMR. 1H and 13C are the most important NMR active nuclei in organic chemistry Natural Abundance 1H 99.9% 13C 1.1% 12C 98.9% (not NMR active)
Normally the nuclear magnetic fields are randomly oriented (b) When placed in an external magnetic field (Bo), the nuclear magnetic field will either aligned with (lower energy) or oppose (higher energy) the external magnetic field Fig 13.3, p. 520
The energy difference between aligned and opposed to the external magnetic field (Bo) is generally small and is dependant upon Bo Applied EM radiation (radio waves) causes the spin to flip and the nuclei are said to be in resonance with Bo Bo = external magnetic field strength • = gyromagnetic ratio 1H= 26,752 13C= 6.7 gBo h 2 p DE = h n DE = h 2p Note that is a constant and is sometimes denoted as h
NMR Active Nuclei: nuclear spin quantum number (I) atomic mass and atomic number Number of spin states = 2I + 1 (number of possible energy levels) Even mass nuclei that have even number of neutron have I = 0 (NMR inactive) Even mass nuclei that have odd number of neutrons have an integer spin quantum number (I = 1, 2, 3, etc) Odd mass nuclei have half-integer spin quantum number (I = 1/2, 3/2, 5/2, etc) I= 1/2: 1H, 13C, 19F, 31P I= 1: 2H, 14N I= 3/2: 15N I= 0: 12C, 16O
Continuous wave (CW) NMR Pulsed (FT) NMR
13.4: Nuclear Shielding and 1H Chemical Shift Different nuclei absorb EM radiation at different wavelength (energy required to bring about resonance) Nuclei of a given type, will resonate at different energies depending on their chemical and electronic environment. The position (chemical shift, ) and pattern (splitting or multiplicity) of the NMR signals gives important information about the chemical environment of the nuclei. The integration of the signal is proportional to the number of nuclei giving rise to that signal
Chemical shift: the exact field strength (in ppm) that a nuclei comes into resonance relative to a reference standard (TMS) Electron clouds “shield” nuclei from the external magnetic field causing them to resonate at slightly higher energy Shielding: influence of neighboring functional groups on the electronic structure around a nuclei and consequently the chemical shift of their resonance. Tetramethylsilane (TMS); Reference standardd = 0 for 1H NMR H–CCl3 downfield lower magnetic field less shielded (deshielded) upfield higher magnetic field more shielded = 7.28 ppm TMS Chemical shift (, ppm)
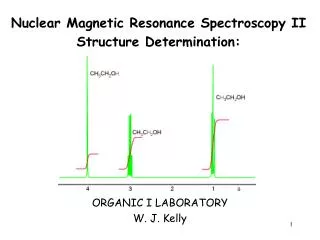
downfield lower magnetic field less shielded (deshielded) NCCH2OCH3 upfield higher magnetic field more shielded • = 3.50 ppm 3H • = 4.20 ppm 2H TMS Chemical shift (, ppm) Vertical scale= intensity of the signal Horizontal scale= chemical shift (d), dependent upon the field strength of the external magnetic field; for 1H, d is usually from 1-10 ppm d= = 14,100 gauss: 60 MHz for 1H (60 million hertz) ppm= 60 Hz 15 MHz for 13C 140,000 gauss: 600 MHz for 1H ppm = 600 Hz 150 MHz for 13C • - nTMSchemical shift in Hz no operating frequency in MHz
H3C-F H3C-O-CH3 (H3C)3-N H3C-CH3 (H3C)4-Si less shielded more shielded 13.5: Effect of Molecular Structure on 1H Chemical Shift Electronegative substituents deshield nearby protons 0.9 0.0 4.3 3.2 2.2 The deshielding effect of a group drops off quickly with distance (number of bonds between the substituent and the proton) H3C-H2C-H2C-H2C-O-CH2-CH2-CH2-CH3 1.37 3.40 0.92 1.55
The influence of neighboring groups (deshielding) on 1H chemical shifts is cumulative = 7.3 5.3 3.1 ppm = 2.1 4.06 5.96 ppm
Typical1H NMR chemical shifts ranges; additional substitution can move the resonances out of the range also see Table 13.1 (p. 548)
Protons attached to sp2 and sp hybridize carbons are deshielded relative to protons attached to sp3 hybridized carbons = 9.7 7.3 5.3 2.1 0.9-1.5 ppm Please read about ring current effects of -bonds (Figs. 13.8-13.10, p. 548-9 & 551) = 2.3 - 2.8 1.5 - 2.6 2.1-2.5 ppm
13.6: Interpreting 1H NMR Spectra Equivalence (chemical-shift equivalence): chemically and magnetically equivalent nuclei resonate at the same energy and give a single signal or pattern • = 3.50 ppm 3H • = 4.20 ppm 2H TMS
Test of Equivalence: 1. Do a mental substitution of the nuclei you are testing with an arbitrary label 2. Ask what is the relationship of the compounds with the arbitrary label • If the labeled compounds are identical (or enantiomers), then the original nuclei are chemically equivalent and do not normally give rise to separate resonances in the NMR spectra If the labeled compounds are not identical (and not enantiomers), then the original nuclei are not chemically equivalent and can give rise to different resonances in the NMR spectra Identical, so the protons are equivalent Identical, so the methyl groups are equivalent
These are geometric isomers (not identical and not enantiomers). The three methyl groups are therefore not chemically equivalent and can give rise to different resonances
Homotopic: equivalent Enantiotopic: equivalent Diastereotopic: non-equivalent