Download
1 / 60
660 likes | 1.22k Vues
Nuclear Magnetic Resonance Spectroscopy II Structure Determination:. ORGANIC I LABORATORY W. J. Kelly. Introduction to NMR Spectroscopy.

E N D
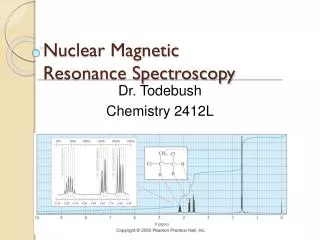
Nuclear Magnetic Resonance Spectroscopy II Structure Determination: ORGANIC I LABORATORY W. J. Kelly
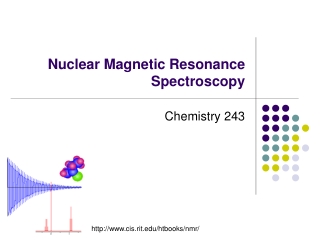
Introduction to NMR Spectroscopy • Nuclear magnetic resonance spectroscopy is a powerful analytical technique used to characterize organic molecules by identifying carbon-hydrogen frameworks within molecules. • Two common types of NMR spectroscopy are used to characterize organic structure: 1H NMR is used to determine the type and number of H atoms in a molecule; 13C NMR is used to determine the type of carbon atoms in the molecule. • The source of energy in NMR is radio waves which have long wavelengths, and thus low energy and frequency. • When low-energy radio waves interact with a molecule, they can change the nuclear spins of some elements, including 1H and 13C.
Introduction to NMR Spectroscopy • When a charged particle such as a proton spins on its axis, it creates a magnetic field. Thus, the nucleus can be considered to be a tiny bar magnet. • Normally, these tiny bar magnets are randomly oriented in space. However, in the presence of a magnetic field B0, they are oriented with or against this applied field. More nuclei are oriented with the applied field because this arrangement is lower in energy. • The energy difference between these two states is very small (<0.1 cal).
Nuclear Magnetic Resonance Spectroscopy Introduction to NMR Spectroscopy • In a magnetic field, there are now two energy states for a proton: a lower energy state with the nucleus aligned in the same direction as B0, and a higher energy state in which the nucleus aligned against B0. • When an external energy source (hn) that matches the energy difference (DE) between these two states is applied, energy is absorbed, causing the nucleus to “spin flip” from one orientation to another. • The energy difference between these two nuclear spin states corresponds to the low frequency RF region of the electromagnetic spectrum.
Introduction to NMR Spectroscopy • Thus, two variables characterize NMR: an applied magnetic field B0, the strength of which is measured in tesla (T), and the frequency n of radiation used for resonance, measured in hertz (Hz), or megahertz (MHz)—(1 MHz = 106 Hz).
Nuclear Magnetic Resonance Spectroscopy Introduction to NMR Spectroscopy • The frequency needed for resonance and the applied magnetic field strength are proportionally related: • NMR spectrometers are referred to as 300 MHz instruments, 500 MHz instruments, and so forth, depending on the frequency of the RF radiation used for resonance. • These spectrometers use very powerful magnets to create a small but measurable energy difference between two possible spin states.
Nuclear Magnetic Resonance Spectroscopy Introduction to NMR Spectroscopy
Nuclear Magnetic Resonance Spectroscopy Introduction to NMR Spectroscopy • Protons in different environments absorb at slightly different frequencies, so they are distinguishable by NMR. • The frequency at which a particular proton absorbs is determined by its electronic environment. • The size of the magnetic field generated by the electrons around a proton determines where it absorbs. • Modern NMR spectrometers use a constant magnetic field strength B0, and then a narrow range of frequencies is applied to achieve the resonance of all protons. • Only nuclei that contain odd mass numbers (such as 1H, 13C, 19F and 31P) or odd atomic numbers (such as 2H and 14N) give rise to NMR signals.
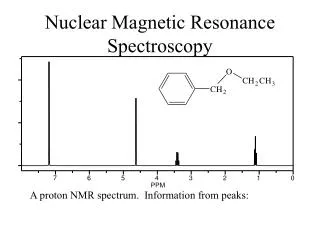
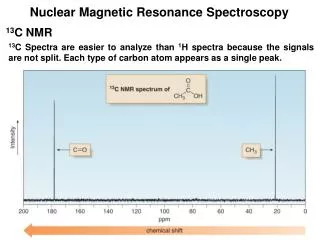
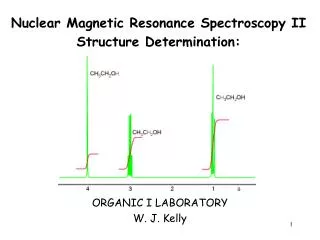
Nuclear Magnetic Resonance Spectroscopy 1H NMR—The Spectrum • An NMR spectrum is a plot of the intensity of a peak against its chemical shift, measured in parts per million (ppm).
Nuclear Magnetic Resonance Spectroscopy 1H NMR—The Spectrum • NMR absorptions generally appear as sharp peaks. • Increasing chemical shift is plotted from left to right. • Most protons absorb between 0-10 ppm. • The terms “upfield” and “downfield” describe the relative location of peaks. Upfield means to the right. Downfield means to the left. • NMR absorptions are measured relative to the position of a reference peak at 0 ppm on the d scale due to tetramethylsilane (TMS). TMS is a volatile inert compound that gives a single peak upfield from typical NMR absorptions.
Nuclear Magnetic Resonance Spectroscopy 1H NMR—The Spectrum • The chemical shift of the x axis gives the position of an NMR signal, measured in ppm, according to the following equation: • By reporting the NMR absorption as a fraction of the NMR operating frequency, we get units, ppm, that are independent of the spectrometer. • Four different features of a 1H NMR spectrum provide information about a compound’s structure: • Number of signals • Position of signals • Intensity of signals. • Spin-spin splitting of signals.
Nuclear Magnetic Resonance Spectroscopy 1H NMR—Number of Signals • The number of NMR signals equals the number of different types of protons in a compound. • Protons in different environments give different NMR signals. • Equivalent protons give the same NMR signal. • To determine equivalent protons in cycloalkanes and alkenes, always draw all bonds to hydrogen.
Nuclear Magnetic Resonance Spectroscopy 1H NMR—Number of Signals
Nuclear Magnetic Resonance Spectroscopy 1H NMR—Number of Signals • In comparing two H atoms on a ring or double bond, two protons are equivalent only if they are cis (or trans) to the same groups.
Nuclear Magnetic Resonance Spectroscopy 1H NMR—Number of Signals • Proton equivalency in cycloalkanes can be determined similarly.
Nuclear Magnetic Resonance Spectroscopy 1H NMR—Position of Signals • In the vicinity of the nucleus, the magnetic field generated by the circulating electron decreases the external magnetic field that the proton “feels”. • Since the electron experiences a lower magnetic field strength, it needs a lower frequency to achieve resonance. Lower frequency is to the right in an NMR spectrum, toward a lower chemical shift, so shielding shifts the absorption upfield.
Nuclear Magnetic Resonance Spectroscopy 1H NMR—Position of Signals • The less shielded the nucleus becomes, the more of the applied magnetic field (B0) it feels. • This deshielded nucleus experiences a higher magnetic field strength, to it needs a higher frequency to achieve resonance. • Higher frequency is to the left in an NMR spectrum, toward higher chemical shift—so deshielding shifts an absorption downfield. • Protons near electronegative atoms are deshielded, so they absorb downfield.
Nuclear Magnetic Resonance Spectroscopy 1H NMR—Position of Signals
Nuclear Magnetic Resonance Spectroscopy 1H NMR—Position of Signals
Nuclear Magnetic Resonance Spectroscopy 1H NMR—Position of Signals
Nuclear Magnetic Resonance Spectroscopy 1H NMR—Chemical Shift Values • Protons in a given environment absorb in a predictable region in an NMR spectrum.
Nuclear Magnetic Resonance Spectroscopy 1H NMR—Chemical Shift Values • The chemical shift of a C—H bond increases with increasing alkyl substitution.
Nuclear Magnetic Resonance Spectroscopy Calculating 1H NMR—Chemical Shift Values • The chemical shift of a C—H can be calculated with a • high degree of precision if a chemical shift additivity table is used. • The additivity tables starts with a base chemical shift value depending on the structural type of hydrogen under consideration: 23
Nuclear Magnetic Resonance Spectroscopy Calculating 1H NMR—Chemical Shift Values • The presence of nearby atoms or groups will effect the base chemical shift by a specific amount: • The carbon atom bonded to the hydrogen(s) under consideration are described as alpha () carbons. • Atoms or groups bonded to the same carbon as the hydrogen(s) under consideration are described as alpha () substituents. • Atoms or groups on carbons one bond removed from the a carbon are called beta () carbons. • Atoms or groups bonded to the carbon are described as alpha () substituents. 24
Nuclear Magnetic Resonance Spectroscopy Calculating 1H NMR—Chemical Shift Values 25
Nuclear Magnetic Resonance Spectroscopy 1H NMR—Chemical Shift Values • In a magnetic field, the six electrons in benzene circulate around the ring creating a ring current. • The magnetic field induced by these moving electrons reinforces the applied magnetic field in the vicinity of the protons. • The protons thus feel a stronger magnetic field and a higher frequency is needed for resonance. Thus they are deshielded and absorb downfield.
Nuclear Magnetic Resonance Spectroscopy 1H NMR—Chemical Shift Values • In a magnetic field, the loosely held electrons of the double bond create a magnetic field that reinforces the applied field in the vicinity of the protons. • The protons now feel a stronger magnetic field, and require a higher frequency for resonance. Thus the protons are deshielded and the absorption is downfield.
Nuclear Magnetic Resonance Spectroscopy 1H NMR—Chemical Shift Values • In a magnetic field, the electrons of a carbon-carbon triple bond are induced to circulate, but in this case the induced magnetic field opposes the applied magnetic field (B0). • Thus, the proton feels a weaker magnetic field, so a lower frequency is needed for resonance. The nucleus is shielded and the absorption is upfield.
Nuclear Magnetic Resonance Spectroscopy 1H NMR—Chemical Shift Values
Nuclear Magnetic Resonance Spectroscopy 1H NMR—Chemical Shift Values)
Nuclear Magnetic Resonance Spectroscopy 1H NMR—Intensity of Signals • The area under an NMR signal is proportional to the number of absorbing protons. • An NMR spectrometer automatically integrates the area under the peaks, and prints out a stepped curve (integral) on the spectrum. • The height of each step is proportional to the area under the peak, which in turn is proportional to the number of absorbing protons. • Modern NMR spectrometers automatically calculate and plot the value of each integral in arbitrary units. • The ratio of integrals to one another gives the ratio of absorbing protons in a spectrum. Note that this gives a ratio, and not the absolute number, of absorbing protons.
Nuclear Magnetic Resonance Spectroscopy 1H NMR—Intensity of Signals
Nuclear Magnetic Resonance Spectroscopy 1H NMR—Spin-Spin Splitting • Consider the spectrum below:
Spin-Spin Splitting in 1H NMR Spectra • Peaks are often split into multiple peaks due to magnetic interactions between nonequivalent protons on adjacent carbons, The process is called spin-spin splitting • The splitting is into one more peak than the number of H’s on the adjacent carbon(s), This is the “n+1 rule” • The relative intensities are in proportion of a binomial distribution given by Pascal’s Triangle • The set of peaks is a multiplet(2 = doublet, 3 = triplet, 4 = quartet, 5=pentet, 6=hextet, 7=heptet…..)
Rules for Spin-Spin Splitting • Equivalent protons do not split each other • Protons that are fartherthantwo carbon atomsapart do not split each other
1H NMR—Spin-Spin Splitting If Ha and Hb are not equivalent, splitting is observed when: Splitting is not generally observed between protons separated by more than three bonds. 45
The Origin of 1H NMR—Spin-Spin Splitting • Spin-spin splitting occurs only between nonequivalent protons on the same carbon or adjacent carbons. Let us consider how the doublet due to the CH2 group on BrCH2CHBr2 occurs: • When placed in an applied field, (B0), the adjacent proton (CHBr2) can be aligned with () or against () B0. The likelihood of either case is about 50% (i.e., 1,000,006 vs 1,000,000). • Thus, the absorbing CH2 protons feel two slightly different magnetic fields—one slightly larger than B0, and one slightly smaller than B0. • Since the absorbing protons feel two different magnetic fields, they absorb at two different frequencies in the NMR spectrum, thus splitting a single absorption into a doublet, where the two peaks of the doublet have equalintensity.
The Origin of 1H NMR—Spin-Spin Splitting The frequency difference, measured in Hz, between two peaks of the doublet is called the coupling constant, J.
The Origin of 1H NMR—Spin-Spin Splitting Let us now consider how a triplet arises: • When placed in an applied magnetic field (B0), the adjacent protons Ha and Hb can each be aligned with () or against () B0. • Thus, the absorbing proton feels three slightly different magnetic fields—one slightly larger than B0(ab). one slightly smaller than B0(ab) and one the same strength as B0 (ab).
The Origin of 1H NMR—Spin-Spin Splitting • Because the absorbing proton feels three different magnetic fields, it absorbs at three different frequencies in the NMR spectrum, thus splitting a single absorption into a triplet. • Because there are two different ways to align one proton with B0, and one proton against B0—that is,abandab—the middle peak of the triplet is twice as intense as the two outer peaks, making the ratio of the areas under the three peaks 1:2:1. • Two adjacent protons split an NMR signal into a triplet. • When two protons split each other, they are said to be coupled. • The spacing between peaks in a split NMR signal, measured by the Jvalue, is equal for coupled protons.