Chapter 4 Molecular Luminescence Spectroscopy
330 likes | 834 Vues
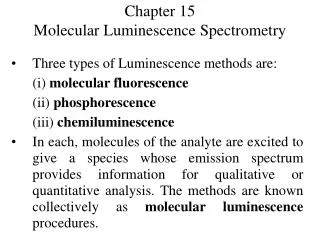
Chapter 4 Molecular Luminescence Spectroscopy. Dr. Professor: Lv Jiagen E-mail: lvjiagen@snnu.edu.cn Tel: 85308442. Molecular Fluorescence Spectroscopy.

Chapter 4 Molecular Luminescence Spectroscopy
E N D
Presentation Transcript
Chapter 4 Molecular Luminescence Spectroscopy Dr. Professor: Lv Jiagen E-mail: lvjiagen@snnu.edu.cn Tel: 85308442
Molecular Fluorescence Spectroscopy Immunofluorescent light micrograph of HeLa cancer cells. The cell in the center of the photo is in the prophase stage of mitotic cell division. In vivo targeting and imaging with QDs.
What is Fluorescence? Fluorescence is a photoluminescence process in which atoms or molecules are excited by absorption of electromagnetic radiation. The excited species then relax to the ground state, giving up their excess energy as photons. Attractive features: 1. One to three orders of magnitude better than absorption spectroscopy, even single molecules have been detected by fluorescence spectroscopy. 2. Larger linear concentration range than absorption spectroscopy. Shortages: Much less widely applicable than absorption methods. More environmental interference effects than absorption methods.
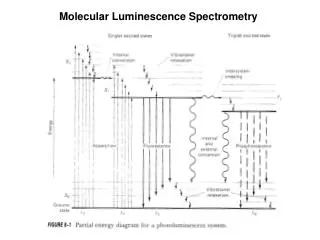
4A-1 Relaxation Processes Once the molecule is excited to EI or E2 several processes can occur that cause the molecule to lose its excess energy. The two most important nonradiative relaxation methods: Vibrational relaxation ----collisions between excited molecules and molecules of the solvent. Nonradiative relaxation ---- from an excited electronic state to another electronic state Vibrational relaxation occurs in 10-12 and 10-9 s Lifetime of an electronic excited state is between 10-9 and 10-6 s. Fluorescence emission occurs in 10-5 s or less.
Desired relaxation From the lowest lying excited electronic state to the ground state. Stokes shift 1 differences, The shift to longer wavelength Relationship between Excitation Spectra and Fluorescence Spectra Because the energy differences between vibrational states is about the same for both ground and excited states, the absorption spectrum, or excitation spectrum, and the fluorescence spectrum for a corn pound often appear as approximate mirror images of one another with overlap occurring near the origin transition (0 vibrational level of E1 to 0 vibrational level of E0).
Fluorescence spectra of 9-Anthracenecarboxylic Acid Fluorescence spectra for 1 ppm anthracene in alcohol.
4A-2 Fluorescent Species All absorbing molecules have the potential to fluoresce, but most compounds do not. quantum yield Structure determines the relaxation and fluorescence emission, as well as quantum yield
Fluorescence and Structure Most intense molecular fluorescence emission structure: aliphatic and alicyclic carbonyl highly conjugate double-bonded aromatic unsubstituted aromatic number of rings degree of condensation
heterocyclics Typical aromatic molecules that do not fluoresce. Typical aromatic compounds that fluoresce.
Table 4-1 Substitution Substitution on an aromatic ring causes shifts in the wavelength of absorption maxima and corresponding changes in the fluorescence peaks.
Substitution of carboxyl Ionization form electron donor Nonization form electron acceptor
The Effect of Structural Rigidity This rigidity lowers the rate of nonradiative relaxation to the point where relaxation by fluorescence has time to occur.
Temperature and Solvent Effects In most molecules, the quantum efficiency of fluorescence decreases with increasing temperature because (he increased frequency of collision at elevated temperatures increases the probability of collisional relaxation. A decrease in solvent viscosity leads to the same result. Collision! Solid fluorescence
4B EFFECT OF CONCENTRATION ON FLUORESCENCE INTENSITY The power of fluorescence radiation F is proportional to the radiant power of the excitation beam absorbed by the system: we write Beer's law in the form where is the molar absorptivity of the fluorescing species and bc is the absorbance A.
Expansion of the exponential term in Equation 27-3 leads to When bc = A < 0.05, the first term inside the brackets, 2.3ebe, is much larger than subsequent terms, and we can write
A plot of the fluorescence power of a solution versus the concentration of the emitting species should be linear at low concentrations. Inerfilter effects
4C FLUORESCENCE INSTRUMENTS Fluorometer wavelength selectors are filters Spectrofluorometer monochromator
Fluorescence methods are 10 to 1000 times more sensitive than absorption methods. Dark background, detected at the right angle direction Components Mercury arc lamps, xenon arc lamps, xenon-mercury arc lamps, and lasers Photomultipliers Monochromators
4D APPLICATIONS OF FLUORESCENCE METHODS Fluorescence spectroscopy is not considered a major structural or qualitative analysis tool, because molecules with subtle structural differences often have similar fluorescence spectra. Fluorescence methods are used to study chemical equilibria and kinetics Fluorescence tags
Quantitative fluorescence methods direct methods indirect methods 4D-1 Methods for Inorganic Species
4D-2 Methods for Organic and Biochemical Species Without question, the most important application of fluorometry is in the analysis of food products, pharmaceuticals, clinical samples, and natural products. More than 200 entries are found under the heading "Fluorescence Spectroscopy of Some Organic Compounds." including such diverse compounds as adenine, anthranilic acid, aromatic polycyclic hydrocarbons, cysteine, guanine, isoniazid, naphthols, nerve gases sarin and tabun, proteins, salicylic acid, skatole, tryptophan, uric acid, and warfarin (Cournadin).
4E MOLECULAR PHOSPHORESCENCE When one of a pair of electrons in a molecule is excited to a higher energy level, a singlet or a triplet state can be produced.
Fluorescence highly probable 10-5 s or less Phosphorescence less probable 10-4 to 104 s oscilloscopes, television sets, and computer monitors long lifetime collision Unavialable at room temperature solid surface Strategies micelle molecular cavity, cyclodextrin
Because of its weak intensity, phosphorescence is much less widely applicable than fluorescence.
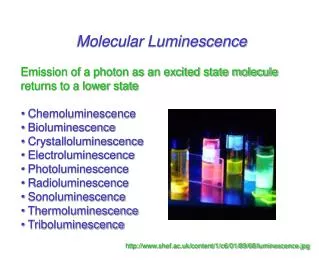
4F CHEMILUMINESCENCE METHODS A chemical reaction yields an electronically excited molecule Bioluminescence in biological systems firefly, the sea pansy, certain jellyfish, bacteria, protozoa, and crustacea Attractive feature of CL simple instrumentation high sensitivity parts per million to parts per billion or lower
A + B → C* + D C* → C + Intensity depends on rate of reaction of production of C*
Applications gases oxides of nitrogen. ozone. and sulfur compounds NO + O3 → NO2* NO2* → NO2 + h 600~875nm , 1ng/cm-3 CO + O → CO2* CO2 * → CO2 + h 300~500nm;1ng/cm-3。 Used to detect NO from 1 ppb to 10 ppt
Inorganic species hydrogen peroxide and some metal ions,immunoassay techniques, DNA probe assays Catalysts!