Download
1 / 31
540 likes | 1.94k Vues
Chapter 15 Molecular Luminescence Spectrometry. Three types of Luminescence methods are: (i) molecular fluorescence (ii) phosphorescence (iii) chemiluminescence

E N D
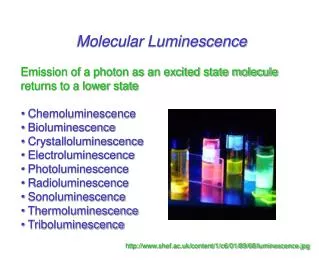
Chapter 15Molecular Luminescence Spectrometry • Three types of Luminescence methods are: (i) molecular fluorescence (ii) phosphorescence (iii) chemiluminescence • In each, molecules of the analyte are excited to give a species whose emission spectrum provides information for qualitative or quantitative analysis. The methods are known collectively as molecular luminescence procedures.
Fluorescence: absorption of photon, short-lived excited state (singlet), emission of photon. • Phosphorescence: absorption of photon, long-lived excited state (triplet), emission of photon. • Chemiluminescence: no excitation source – chemical reaction provides energy to excite molecule, emission of photon. • Luminescence: High sensitivity strong signal against a dark background. • Used as detectors for HPLC & CE.
THEORY OF FLUORESCENCE AND PHOSPHORESCENCE Types of Fluorescence: • Resonance (emitted = excitation ; e.g., AF) • Stokes shift (emitted > excitation ; e.g., molecular fluorescence)
Electron spin and excited states • Excited, paired = excited singlet state fluorescence • Excited, unpaired = excited triplet state phosphorescence
Deactivation • Process by which an excited molecule returns to the ground state • Minimizing lifetime of electronic state is preferred (i.e., the deactivation process with the faster rate constant will predominate) Radiationless Deactivation Without emission of a photon (i.e., without radiation)
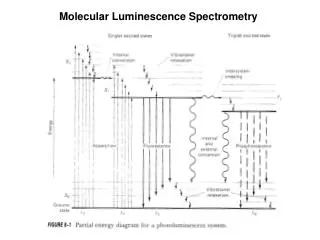
TERMS FROM ENERGY-LEVEL DIAGRAM Term: Absorption Effect: Excite Process: Analyte molecule absorbs photon (very fast ~ 10-14 – 10-15 s); electron is promoted to higher energy state. Slightly different wavelength excitation into different vibrational energy levels. Term: Vibrational Relaxation Effect: Deactivate, Radiationless Process: Collisions of excited state analyte molecules with other molecules loss of excess vibrational energy and relaxation to lower vibrational levels (within the excited electronic state)
Term: Internal conversion Effect: Deactivate, Radiationless Process: Molecule passes to a lower energy state – vibrational energy levels of the two electronic states overlap (see diagram) and molecules passes from one electronic state to the other. Term: Fluorescence Effect: Deactivate, Emission of h Process: Emission of a photon via a singlet to singlet transition (short – lived excited state ~10-7 – 10-9 s).
Term: Intersystem Crossing Effect: Deactivate, Radiationless Process: Spin of electron is reversed leading to change from singlet to triplet state. Occurs more readily if vibrational levels of the two states overlap. Common in molecules with heavy atoms (e.g., I or Br)
Term: External Conversion Effect: Deactivate, Radiationless Process: Collisions of excited state analyte molecules with other molecules molecule relaxes to the ground state without emission of a photon. Term: Phosphorescence Effect: Deactivate, Emission of h Process: Emission of a photon via a triplet to single transition (long–lived excited state ~ 10-4 – 101s)
Quantum Yield The quantum yield or quantum efficiency for fluorescence or phosphorescence is the ratio of the number of molecules that luminesce to the total number of excited molecule. Gives a measure of how efficient a fluorophore (i.e., fluorescing molecule) is. • A quantum yield = 1 means that every excited molecules deactivates by emitting a photon – such a molecule is considered a very good fluorophore. • Can express quantum yield as a function of rate constants
Fluorescence and Structure • Low–energy * (aromatic): most intense fluorescence. • Heterocycles do not fluoresce; heterocycles fused to other rings fluoresce. Heteroatom increases ISC then f decreases. • Conjugated double bond structures exhibit fluorescence. • Structural rigidity (e.g., naphthalene or fluorene vs biphenyl). Flexibility increases then f decreases. • Temperature: increase fluorescence intensity with decreasing T (reduce number of deactivating collisions).
Solvent: increase fluorescence with increased viscosity (decreased likelihood of external conversion – radiationless deactivation) • Heavy atoms such as I, Br, Th increases ISC as a consequence f decreases • pH: Increased resonance structures (protonation or deprotonation) stable excited state and greater quantum yield • pH can also influence emission wavelength (changes in acid dissociation constant with excitation)
FLUORESCENCE INTENSITY AND CONCENTRATION OF ANALYTE F = Kc (fluorescence intensity depends linearly on concentration) • Deviations occur at high concentrations • Self absorption: neighboring molecule absorbs emitted photon from other molecule – happens if there is overlap between the excitation and emission spectra • Quenching: collisions of excited state molecule with other excited state molecules radiationless deactivation
Deviation from high excitation light intensity • Photobleaching: Excited state molecule absorbs another photon and is destroyed destroyed excited state molecule is not able to emit fluorescent photon
EXCITATION AND EMISSION SPECTRA • Excitation spectrum: Emission wavelength is fixed; excitation wavelength is scanned • Monochromator or filters selected to allow only one of fluorescent light to pass through to the detector. • Excitation wavelength is varied – at each excitation increment fluorescent photons at the fixed emission are collected. • The emission intensity (i.e., the number of fluorescent photons collected) at each increment varies as the excitation comes closer to or goes further from the of maximum absorption this is why an excitation spectrum looks like an absorption spectrum.
Emission spectrum: Excitation wavelength is fixed; emission wavelength is scanned • Molochromator or filter is selected to allow only one of excitation light to pass onto the sample. • Emission is varied fluorescent photons are collected at each incremental emission . • The emission intensity (i.e., the number of fluorescent photons collected) at each increment varies as the emission is changed. • Spectrum shows at what the fluorescence intensity is a maximum for a given excitation .
INSTRUMENTATION • Sources • Hg lamp (254 nm) • Xe lamp (300 – 1300 nm) • Filter/monochromator • Isolate excitation • Scan excitation • Isolate emission from excitation • Scan emission • Detector • Usually PMT: very low light levels are measured.
Phosphorescence Instrumentation • Chopper: time-delay for excitation and measurement/collection of phosphorescence signal (eliminate fluorescence). • Liquid nitrogen: cooling necessary to eliminate collisional deactivation.