Download
1 / 16
170 likes | 316 Vues
Juanita R i año Transparency International www.transparency.org. The Empirics of Governance May 1-2, 2008 Washington D.C. Measuring governance and corruption internationally: progress thus far. Corruption high on the international agenda Increased understanding of its nature :

E N D
Juanita Riaño Transparency International www.transparency.org The Empirics of Governance May 1-2, 2008 Washington D.C.
Measuring governance and corruption internationally: progress thus far • Corruption high on the international agenda • Increased understanding of its nature: • supported by broader research base • Growth in development of new measurement tools: • especially surveys • at global, regional and national levels • complemented by other initiatives and tools
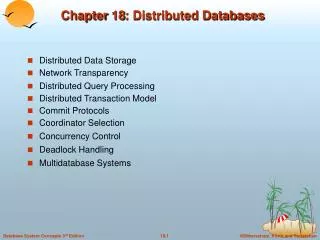
Validity Measurement Tools: Production Process Legitimacy, credibility, reliability What for? (Purpose) Type Method Sample Data Measurement process What (Target) What’s possible? (Resources, information, capacity) Use (communication, advocacy, interpretation etc.)
Measurement Tools: Production Process What for? (Purpose) • Awareness • Academic research • Advocacy, Policy reform • Diagnostics (targeting action) • Monitoring (policy evaluation) What do we want to measure? (Target) • Costs of Corruption • Trends of corruption • Extent of corruption What’s possible? • Information available • Capacity • Funding • What you want and what you need
Aggregate Indicators: What for? • To create public awareness of corruption and put corruption on the public debate contributing to create a climate for change. • To offer a snapshot of the extent of the corruption problem. • To enhance comparative understanding of levels of corruption and trends over time. • To motivate new research and complementary diagnostic analysis on causes and consequences of corruption.
Aggregate Indicators: What NOT? and What NOT for? WHAT NOT: • Not an in-countrydiagnostic tool: doesn’t offer analysis on causes, dynamics or consequences of corruption WHAT NOT FOR: • Not to make inferences about petty/grand corruption, public-private sector interface, etc. • Not to design policy actions or country reforms.
Perceptions-based data • Unbiased, hard data difficult to obtain or validity questionable • e.g. comparing number of prosecutions, court cases or media coverage as a way to measure effectiveness and capacity of a country's judiciary in prosecuting corruption. • Legal definition of bribery and corruption may differ (e.g. facilitation payments) • Perception questions have become more rigorous, experiential and quantitative. • Cultural biases seem not to be as strong as they were originally thought (tested e.g. by vignettes) • Even the fact-based data have elements of subjectivity involved
Interpreting perceptions • Potential bias resulting from cultural background. • Residents • Comparing to other problems, not countries • Standard of ethics • Expatriates • Dominance of a cultural heritage in the sample • Lacking cultural understanding
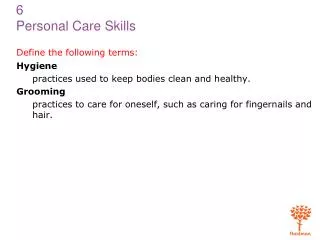
What about people perceptions regarding corruption vs. experts perceptions? r=0.64 Source: Transparency International Global Corruption Barometer 2007 and CPI 2007
At the National Level… • TI national chapters have developed a wide range of tools that provide indicators for the fight against corruption: • National household surveys: TI Bangladesh, TI Lithuania, TI Madagascar, TI Mexico, TI Morocco, TI Peru, TI Russia • Index of public institutions: TI Kenya, TI Colombia • Public sector diagnostics: TI Bangladesh, TI Nicaragua • Monitoring political party financing: TI Bulgaria, TI Latvia • Private sector assessment: TI Mexico, TI Madagascar
The Kenya Bribery Index, an example. • Captures bribery experiences among general public on an annual basis • Who is bribed, how much and for what? • Results have been used to • Provide information on the nature and extent of bribery in Kenya • Generate public awareness • Advocate for and support reforms • Setperformance targets and monitor reforms
Lessons learned • Methodolgies • Use of expertise • Right for the purpose of the tool • Process: validation (external, internal) – who else has seen it? • Communication: as important as production • If the tool is solid, criticism is a sign of success • Don‘t ask more from a tool than it can bear
Measuring corruption: challenges ahead • Improving use of results by various stakeholders (civil society, private sector and governments) and to convert research into policy. • Taking stock of what we have learnt, without reinventing the wheel. • Strengthening research in diagnostic indicators. • Supporting repetition of tools over time, in order to set performance targets and measure anti-corruption efforts. • Extending coverage of measuring corruption tools to countries/sectors where no data-research has been conducted so far.
the coalition against corruption www.transparency.org