Download
1 / 35
350 likes | 391 Vues
This comprehensive report explores rainfall intensity, temperature and humidity profiles, and radiosonde comparisons, providing valuable insights for climate services. Learn about operational radiosonde improvements and the significance of the GRUAN network for upper air observations. Discover the impact of GPS-RO data assimilation on global weather modeling and the latest advancements in AMDAR networks. Stay informed with detailed findings and recommendations from industry experts.

E N D
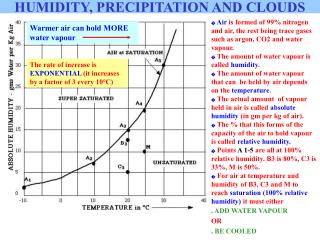
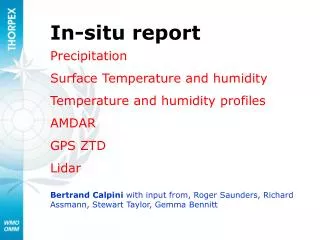
In-situ report Precipitation Surface Temperature and humidity Temperature and humidity profiles AMDAR GPS ZTD Lidar Bertrand Calpiniwith input from, Roger Saunders,Richard Assmann, Stewart Taylor, Gemma Bennitt
1. Rainfall Intensity • Final report on the WMO CIMO webpage
Field Intercomparison of Thermometer Screens/Shields and Humidity Measuring Instruments (17*2 screens) LBOM VROT SDAV LCOC LLAN VYOU VTHY SCAE VDAV SYOU VEIG SSOC
Field Intercomparison of Thermometer Screens/Shields and Humidity Measuring Instruments
Field Intercomparison of Thermometer Screens/Shields and Humidity Measuring Instruments Differences in the time of occurrence of daily maximum temperatures
Gardaia Results • Even some low-cost screen appear with very good performance • Consequences for climate services: • Maximum daily temperature delay: up to 3hrs • Maximum temperature error: up to 1.5deg • Final report on the WMO CIMO webpage
3. Radiosonde 8th WMO International Radiosonde Comparison. Yangjiang, Guangdong, China 12 July – 3 August 2010 Participants: 11 manufacturers from China, Finland, France, Germany, Japan, Korea, South Africa, Switzerland, USA
Tropical/subtropical moist conditions Tropopause & 16km Temperature >> -90deg
Yangjiang Results • Unprecedented performances achieved with QRS • No pressure sensor needed anymore for GPS radiosonde with a direct impact on lowering the cost of radiosonde • Intercomparison results used to facilitate selection of systems for national purposes, minimizing additional performance testing on a national level (WTO procedures). • Recommendations on vendors to improve their operational radiosonde >>> Final report on the WMO CIMO webpage
What is GRUAN? • GCOS Reference Upper Air Network • Network for ground-based reference observations for climate in the free atmosphere in the frame of GCOS • Initially 15 stations, envisaged to be a network of 30-40 sites across the globe • See www.gruan.org for more detail
GRUAN goals • Maintain observations over several decades for accurately estimating climate variability and change • Focus on characterizing observational biases, including complete estimates of measurement uncertainty • Ensure traceability of measurements by comprehensive metadata collection and documentation • Ensure long-term stability by managing instrumental changes • Tie measurements to SI units or internationally accepted standards • Measure a large suite of co-related climate variables with deliberate measurement redundancy Priority 1: Water vapor, temperature, (pressure and wind) Priority 2: Ozone, clouds, …
Monitoring with GPS-RO Vaisala RS92: (COSMIC - RS92)/RS92 SIPPICAN (USA): (COSMIC – SIPP)/SIPP Co-located COSMIC and radiosonde refractivity (3 hrs, 300 km) Very small bias Sonde’s understimate humidity
E-AMDAR: Network Developments 1. 1st Nov 2010 - EZY fleets providing data over UK domain and selected European airports. Software installed on BAW A319 (LCY – SNN – JFK). But when a volcano erupts coverage is reduced! 26
AMDAR reports from Alaskan Airlines received from 25 March 2011 an extra 110 aircraft reporting ~10% increase in AMDAR reports globally 230 dropsonde reports over North Pacific during March 2011 – good quality 57% reduction of Canadian AMDARs over 2 years, but levelled-off recently New Canadian ADS data received from 4 March 2011 over western North Atlantic Some stats
Ground-based GPSObservations available from E-GVAP http://egvap.dmi.dk
Ground-based GPS NAE and UK models: • ~18 000 zenith total delay (ZTD) observations assimilated into NAE model per day, ~1400 in UK models. • Recent study focusing on heavy rainfall events with UK4 model showed 10.9% increase in ETS for 6 hour precip accumulation when ZTDs assimilated. Global model: • Trials of assimilating ZTD into global NWP model underway • Met Office and Czech republic now produce global near real-time ZTD observations (not yet available on GTS)
Met office Observation Monitoring – some notable events 2010/11 Volcanic ash episode in April 2010: few AMDARs, but more TEMPs - looked for changes in temperature bias at TEMP stations (as biased AMDARs removed) - no significant changes seen Loss of ~40% Canadian sonde winds due to demise of Loran-C on 1/08/10 - impact minimised by CMC producing winds at either 00Z or 12Z at nearby stations Antarctic Concordiasi campaign Sep-Nov 2010 - 560 dropsondes received and assimilated at the Met Office - >50000 balloon winds + temps received/assimilated from 19 gondola balloons AMDAR data over UK increased by 65% on 1/11/10 due to EasyJet data (for a 6-month trial period) - quality similar to other E-AMDAR data E-AMDAR processing problems 28-29 Nov 2010 - few AMDARs on 28 Nov, but old data queued & sent on 29 Nov, resulting in rms o-b vector wind 50% higher (10% for assim’d data) than usual in 12UTC run & probable degradation in forecast 2Greenland stations’ TEMP reports corrupted since January 2011 - - data missing 700-100hPa from stations 04220 & 04270 at Met Office (& MeteoFrance) due to coding errors in reports Winds from 102 European wind profilers/weather radars now assimilated at Met Office - Norwegian WRWP wind quality improved in spring 2010, but Spanish WRWP quality still poor (no Finnish winds assimilated 2 Nov – 8 Dec 2010, as profiles received in reverse height order)
Issues for NWP • Transition to BUFR for radiosondes provide new opportunities • Global GPS total zenith delay • In-situ soil moisture and temp • Common format for precip radar data • To improve estimates of solid precipitation and develop guidance on the accuracy and temporal resolution of solid precipitation parameters • New observations needed for mesoscale
DAOS-WG statement on need for additional in-situ observations There is increasing evidence based upon results from A-TREC, TPARC, AMMA (in the form of OSEs, adjoint-based observation impact studies, and analysis uncertainty estimates) to recommend, if feasible, increases in observations from: • Commercial aircraft over the N. Pacific, N. Atlantic, and the S. Hemisphere in general. • Additional soundings from certain coastal radiosondes, including those in eastern Siberia, and perhaps selected stations in polar regions, Africa, and South America. to improve NWP forecasts in the 2-5 day timeframe.