Download
1 / 15
160 likes | 350 Vues
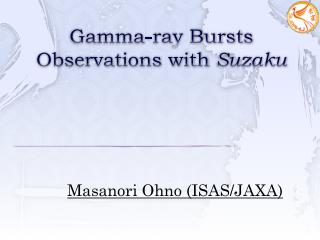
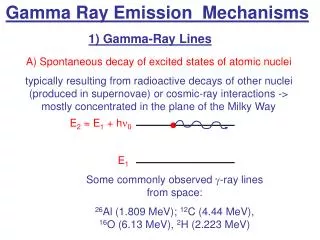
Soft Gamma-ray observations of GRB prompt emission with Suzaku Wideband All-sky Monitor. Masanori Ohno , Yasushi Fukazawa, Kazutaka Yamaoka, Satoshi Sugita, Yukikatsu Terada, Soojing Hong, Makoto Tashiro, Motohide Kokubun, Kazuo Makishima, Goro Sato, Kazuhiro Nakazawa, Tadayuki Takahashi

E N D
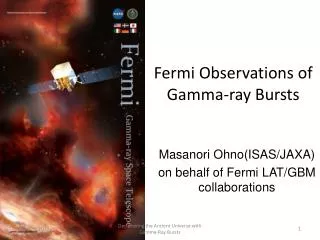
Soft Gamma-ray observations of GRB prompt emission with Suzaku Wideband All-sky Monitor Masanori Ohno, Yasushi Fukazawa, Kazutaka Yamaoka, Satoshi Sugita, Yukikatsu Terada, Soojing Hong, Makoto Tashiro, Motohide Kokubun, Kazuo Makishima, Goro Sato, Kazuhiro Nakazawa, Tadayuki Takahashi and the HXD-II team Swift and GRBs
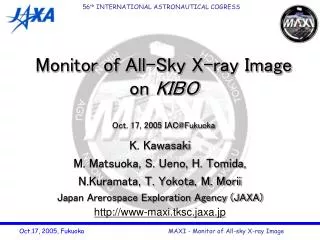
I. Suzaku Wideband All-sky Monitor (WAM) Wideband All-sky Monitor (HXD-WAM) Suzaku/HXD Suzaku/HXD is surrounded By thick (4cm) large (38cm) 20 BGO crystals • Large effective area • Wide field of view cross-section top-view Effective area cross section top view Swift-BAT Energy band: 50-5000 keV Effective area : 400cm@1MeV HXD-WAM highest sensitivity from 300 To 5000 keV than other GRB satellite 300 5000 Swift and GRBs
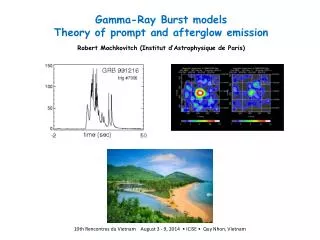
II. GRB sciences with the WAM Obtain the unbiased Epeak distribution. Preece et al. 2000 • There are few sample of • high energy Epeak. • High sensitive observation • up to MeV region is needed. 100 1000 Gonzalez et al. 2003 GRB941017 Does MeV-GeV excess emission really exists? What’s origin? • Delayed excess emission against • main synchrotron emission. • Time variability around MeV region • is important. 102 103 104 (keV) Swift and GRBs
Today’s topic The WAM has started GRB observation since Aug. 22 2005 and many GRBs triggered the WAM Today’s main talk: in-orbit GRB observation with the WAM • current status of the WAM • ・ trigger status • ・ spectral results • Swift/BAT joint analysis ・ cross-calibration ・ Epeak distribution ・ Ep-Eiso correlation Swift and GRBs
III. GRB observations with WAM~Trigger status~ GRB trigger level : 8.0σ(Aug. 22-Oct. 31) 5.7σ(Oct.31- ) Lightcurve samples Short GRBs 1sec Confirmed 47 Possible 36 SGR 7 Solar flare 20 Particle event 55 SAA 8 noise 88 Others 9 83 Single peak 20sec Multiple peak (Aug. 22 05 – Apr. 31 06) GRB detection rate is ~120 / year Swift and GRBs
III. GRB observations with WAM~ GRB spectra obtained by WAM ~ MeV emission is detected from some GRBs ! GRB051008 GRB060213 GRB060317 MeV emission ! The in-orbit performance is almost same as we expected ! Swift and GRBs
IV. WAM+BAT joint analysis~ joint fitting with Swift/BAT ~ Some GRBs are detected by WAM and Swift/BAT simultaneously WAM+BAT joint fitting WAM • wider coverage • for Epeak • Cross calibration • for each other Swift/BAT 10 - 20 % Now, WAM response uncertainty was fixed within 10-20% in more than 100 keV band Swift and GRBs
IV. WAM+BAT joint analysis~ Epeak with WAM-BAT joint fitting ~ Many GRBs can be determined the Ep by joint fit with Swift/BAT Epeak (keV) GRB051008 GRB051111 GRB051221 GRB060105 GRB060111 GRB060117 GRB060306 GRB060501 GRB060502 WAM+BAT joint fit is very powerful tool for Ep ! Swift and GRBs
IV. WAM+BAT joint analysis ~ Epeak distribution ~ Epeak distribution from all position determined GRBs (WAM-BAT joint fit + IPN localized GRBs) Number of events • WAM results • normalized • BATSE results • ( Preece et al. 2000) Similar to BATSE results but Broader in high energy band than BATSE ?? more samples are required ! Ep (log) Swift and GRBs
IV. WAM+BAT joint analysis ~ Ep-Eiso correlation ~ GRB051221 short GRB (z=0.54) Short GRB does not meet Amati relation (Amati et al. 2006) GRB050904 Highest redshift(z=6.29) high-z GRB also satisfies Amati-relation GRB05111 long GRB(z=1.55) WAM only detected hard prompt emission Ep-Eiso correlation Ep,src(keV) Eiso(1052erg) Swift and GRBs
IV. Spectral Evolution of GRBs~ variability upto MeV enegy band ~ Time variability upto MeV band from some GRBs • Search for spectral evolution in MeV region • Detail analysis is in progress GRB051008 GRB060213 50-100 keV 100-300keV 300-500keV 500-1000keV 1000-2000keV Swift and GRBs
V. Summary Suzaku Wideband All-sky Monitor (WAM) is the powerful GRB monitor up to MeV band In-orbit performance of the WAM is same as we expected - Trigger rate is same as we expected - MeV emission is detected from some GRBs WAM+BAT joint analysis is very powerful tool to obtain large Ep set • also useful for cross-calibration • -spectral evolution in wider energy range Swift and GRBs
III. GRB observations with WAM~ Duration distribution ~ T90 distribution with all GRB candidates (confirmed +possible) Confirmed Possible Confirmed + posibble Normalized BATSE 4B T90 distribution shows bimodal structure same as BATSE Swift and GRBs