Download
1 / 50
500 likes | 717 Vues
Descriptive Statistics: Numerical Measures Exploratory Data Analysis. Chapter 3 BA 201. Exploratory Analysis. Five-Number Summary. 1. Smallest Value. 2. First Quartile. 3. Median. 4. Third Quartile. 5. Largest Value. Five-Number Summary. Apartment Rents. Lowest Value = 425.

E N D
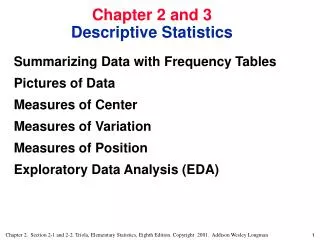
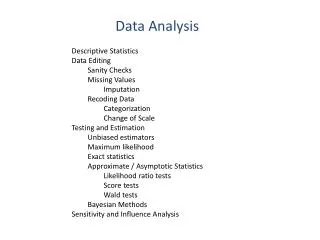
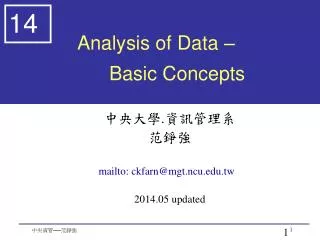
Descriptive Statistics: Numerical MeasuresExploratory Data Analysis Chapter 3 BA 201
Five-Number Summary 1 Smallest Value 2 First Quartile 3 Median 4 Third Quartile 5 Largest Value
Five-Number Summary Apartment Rents Lowest Value = 425 First Quartile = 445 Median = 475 Largest Value = 615 Third Quartile = 525
Box Plot A box plot is a graphical summary of data that is based on a five-number summary. A key to the development of a box plot is the computation of the median and the quartiles Q1 and Q3. Box plots provide another way to identify outliers.
625 450 400 500 525 550 575 600 425 475 Box Plot Apartment Rents • A box is drawn with its ends located at the first and third quartiles. • A vertical line is drawn in the box at the location of • the median (second quartile). Q1 = 445 Q3 = 525 Q2 = 475
Box Plot • Limits are located (not drawn) using the interquartile range (IQR). • Data outside these limits are considered outliers. • The locations of each outlier is shown with the symbol* .
Box Plot Apartment Rents • The lower limit is located 1.5(IQR) below Q1. Lower Limit: Q1 - 1.5(IQR) = 445 - 1.5(80) = 325 • The upper limit is located 1.5(IQR) above Q3. Upper Limit: Q3 + 1.5(IQR) = 525 + 1.5(80) = 645 • There are no outliers (values less than 325 or • greater than 645) in the apartment rent data.
625 450 400 500 525 550 575 600 425 475 Box Plot Apartment Rents • Whiskers (dashed lines) are drawn from the ends of the box to the smallest and largest data values inside the limits. Smallest value inside limits = 425 Largest value inside limits = 615
625 450 400 500 525 550 575 600 425 475 Box Plot Apartment Rents
Box Plot • An excellent graphical technique for making • comparisons among two or more groups.
Practice – Box Plot Minimum Maximum Median
Practice – Box Plot Minimum Maximum Median 1st Quartile 3rd Quartile
Practice – Box Plot Minimum Maximum Median 1st Quartile 3rd Quartile 20 25 10 15 0 5
Practice – Box Plot 1st Quartile 3rd Quartile Lower Limit Upper Limit 20 25 10 15 0 5
Measures of Association Between Two Variables Thus far we have examined numerical methods used to summarize the data for one variable at a time. Often a manager or decision maker is interested in the relationship between two variables. Two descriptive measures of the relationship between two variables are covariance and correlation coefficient.
Covariance The covariance is a measure of the linear association between two variables. Positive values indicate a positive relationship. Negative values indicate a negative relationship.
Covariance The covariance is computed as follows: for samples for populations
Correlation Coefficient Correlation is a measure of linear association and not necessarily causation. Just because two variables are highly correlated, it does not mean that one variable is the cause of the other.
Correlation Coefficient The correlation coefficient is computed as follows: for samples for populations
Correlation Coefficient The coefficient can take on values between -1 and +1. Values near -1 indicate a strong negative linear relationship. Values near +1 indicate a strong positive linear relationship. The closer the correlation is to zero, the weaker the relationship.
Covariance and Correlation Coefficient Golfing Study A golfer is interested in investigating the relationship, if any, between driving distance and 18-hole score. Average Driving Distance (yds.) Average 18-Hole Score 69 71 70 70 71 69 277.6 259.5 269.1 267.0 255.6 272.9
Covariance and Correlation Coefficient Golfing Study
Covariance and Correlation Coefficient Golfing Study
Covariance and Correlation Coefficient Golfing Study
Covariance and Correlation Coefficient Golfing Study • Sample Covariance • Sample Correlation Coefficient
Clarification (Day Class) • If x and y are positively correlated • x and y move in the same direction. • As x increases, y increases. (Also, as x decreases, y decreases.) • If x and y are negatively correlated • x and y move in opposite directions. • As x increases, y decreases. (Also, ax x decreases, y increases.)
Practice - Covariance andCorrelation Coefficient Do the following: Compute the mean and standard deviation for x and y. Compute the Covariance and Correlation Coefficient.
Practice - Covariance andCorrelation Coefficient Covariance Correlation Coefficient
The Weighted Mean andWorking with Grouped Data • Weighted Mean • Mean for Grouped Data • Variance for Grouped Data • Standard Deviation for Grouped Data
Weighted Mean • When the mean is computed by giving each data • value a weight that reflects its importance, it is • referred to as a weighted mean. • In the computation of a grade point average (GPA), • the weights are the number of credit hours earned for • each grade. • When data values vary in importance, the analyst • must choose the weight that best reflects the • importance of each value.
Weighted Mean where: xi= value of observation i wi = weight for observation i
Grouped Data • The weighted mean computation can be used to • obtain approximations of the mean, variance, and • standard deviation for the grouped data. • To compute the weighted mean, we treat the • midpoint of each class as though it were the mean • of all items in the class. • We compute a weighted mean of the class midpoints • using the class frequencies as weights. • Similarly, in computing the variance and standard • deviation, the class frequencies are used as weights.
Mean for Grouped Data • Sample Data • Population Data where: fi = frequency of class i Mi = midpoint of class i
Sample Mean for Grouped Data Apartment Rents The previously presented sample of apartment rents is shown here as grouped data in the form of a frequency distribution.
Sample Mean for Grouped Data Apartment Rents This approximation differs by $2.41 from the actual sample mean of $490.80.
Variance for Grouped Data • For sample data • For population data
continued Sample Variance for Grouped Data Apartment Rents
Sample Variance for Grouped Data Apartment Rents • Sample Variance s2 = 208,234.29/(70 – 1) = 3,017.89 • Sample Standard Deviation This approximation differs by only $.20 from the actual standard deviation of $54.74.