Numerical Descriptive Techniques
Numerical Descriptive Techniques. Week 3 GT00303. Overview. Measures of Central Location Arithmetic Mean, Median, Mode, Geometric Mean Measures of Variability Range, Standard Deviation, Variance, Coefficient of Variation, Interquartile Range Measures of Relative Standing


Numerical Descriptive Techniques
E N D
Presentation Transcript
Numerical Descriptive Techniques Week 3 GT00303
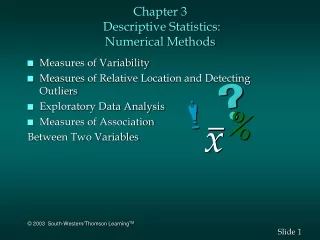
Overview Measures of Central Location Arithmetic Mean, Median, Mode, Geometric Mean Measures of Variability Range, Standard Deviation, Variance, Coefficient of Variation, Interquartile Range Measures of Relative Standing Percentiles, Quartiles Measures of Linear Relationship Covariance, Coefficient of Correlation, Coefficient of Determination 3-2
Measures of Central Location (1) Arithmetic Mean • appropriate for describing interval data, e.g. heights of people, exam marks, etc. • calculation not valid for nominal and ordinal data • is seriously affected by extreme values called “outliers”. E.g. as soon as a billionaire moves into a neighborhood, the average household income increases beyond what it was previously! 3-3
Population Mean Sample Mean x-bar mu 3-4
Illustration 1 There are 42 exits on I-75 through the state of Kentucky. Listed below are the distances between exits (in miles). Why is this information a population? This is a population because we are considering all the exits in Kentucky. What is the mean number of miles between exits? 3-5
Illustration 2 3-6
(2) Median The midpoint of the values after they have been ordered from the smallest to the largest • one unique median for each data set (odd and even n) • not affected by extremely large or small values and is therefore a valuable measure of central tendency when such ‘outliers’ occur • can be computed for interval and ordinal data • sample and population medians are computed the same way 3-7
Illustration 3 The heights of eight basketball players, in inches, are: 70, 76, 73, 80, 75, 72, 88, 68 Arranging the data in ascending order gives: 68, 70, 72, 73, 75, 76, 80, 88 Given n= 8 (even), the median is the simple average between 73 & 75, i.e., 74 The ages for a sample of seven college students are: 21, 25, 19, 20, 22, 17, 27 Arranging the data in ascending order gives: 17,19, 20, 21, 22, 25, 27 Given n= 7 (odd), the median is 21. 3-8
(3) Mode The value of the observation that appears most frequently. • a set of data may have one mode (or modal class), or two, or more modes • useful for all data types, though mainly used for nominal data. • for large data sets the modal class is much more relevant than a single-value mode. • Sample and population modes are computed the same way 3-9
Illustration 4 Using the data regarding the distance in miles between exits on I-75 through Kentucky. The information is repeated below. What is the modal distance? Organize the distances into a frequency table. 3-10
Illustration 5 Calculate the mean and median for the following data: 0 7 12 5 33 14 8 0 9 22 For median, sort the data in ascending order: 0 0 5 7 8 9 12 14 22 33 Given n = 10 (even), the median is 8.5 3-12
Suppose there is a data error: 0 7 12 5 33 14 8 0 9 22 133 For median, sort the data in ascending order: 0 0 5 7 8 9 12 14 22 33 Given n = 10 (even), the median is 8.5 3-13
This mean of 21 is only exceeded by two of the ten observations in the sample, making this statistic a poor measure of central location. The median stays the same (=8.5). When there is a relatively small number of extreme observations or outliers (either very small or very large, but not both), the median usually produces a better measure of the center of the data. The mode is seldom the best measure of central location. 3-14
(4) Geometric Mean • useful in finding the average change of percentages, ratios, indexes, or growth rates over time. • has wide application in business and economics because we are often interested in finding the percentage changes in sales, salaries, or economic figures, such as the GDP, which compound or build on each other • will always be less than or equal to the arithmetic mean. 3-15
Illustration 6 Suppose you make a 2-year investment of $1,000 and it grows by 100% to $2,000 during the first year. During the second year, however, the investment suffers a 50% loss, from $2,000 back to $1,000. The rates of return for years 1 and 2 are R1 = 100% and R2 = –50%, respectively. Compute the average rate of return on investment. 3-16
The geometric mean Rg of the returns is defined such that 3-17
Measures of Variability Measures of central location fail to tell the whole story about the distribution; that is, how much are the observations spread out around the mean value? For example, two sets of class grades are shown. The mean (=50) is the same in each case… But, the red class has greater variability than the blue class. 3-18
(1) Range Range = Maximum – Minimum Data: {4, 4, 4, 4, 50} Range = 46 Data: {4, 8, 15, 24, 39, 50} Range = 46 The range is the same in both cases, but the data sets have very different distributions. Range ignores the dispersion of the observations between the two end points. 3-19
(2) Variance The arithmetic mean of the squared deviations from the mean. • For populations whose values are near the mean, the variance and standard deviation will be small. • For populations whose values are dispersed from the mean, the population variance and standard deviation will be large. • For variance, the unit is the square of the unit attached to the original observation. If Xs are hours, then the variance will be (hours)2. • The unit associated with the standard deviation is the unit of the original data. If Xs are hours, then the standard deviation will also be hours. 3-20
Population Variance Sample Variance sigma 3-21
LO8 Illustration 7 The number of traffic citations issued during the last five months in Beaufort County, South Carolina, is reported below: What is the population variance? 3-22
Illustration 8 The hourly wages for a sample of part-time employees at Home Depot are: $12, $20, $16, $18, and $19. What is the sample variance? 3-23
(3) Standard Deviation The squareroot of the variance. Sample Standard Deviation Population Standard Deviation The standard deviation can be used to compare the variability of several distributions and make a statement about the general shape of a distribution. 3-24
Empirical Rule for Symmetrical Distribution Approximately 68% of all observations fall within one standard deviation of the mean. Approximately 95% of all observations fall within two standard deviations of the mean. Approximately 99.7% of all observations fall within three standard deviations of the mean. 3-25
Chebysheff’s Theorem A more general interpretation of the standard deviation is derived from Chebysheff’s Theorem, which applies to all shapes of histograms (not just bell shaped). The proportion of observations in any sample that lie within k standard deviations of the mean is least: E.g. If k=2, the theorem states that at least 3/4 of all observations lie within 2 standard deviations of the mean. 3-26
Illustration 9 Suppose that the mean and standard deviation of last year’s mid-term test marks are 70 and 5, respectively. If the distribution is bell-shaped, then: • Approximately 68% of the marks fell between 65 and 75 ( +1 SD) • Approximately 95% of the marks fell between 60 and 80 ( +2 SD)Approximately 99.7% of the marks fell between 55 and 85 ( +3 SD) If the distribution is not bell-shaped, then: At least 75% of the marks fell between 60 and 80 ( +2 SD) At least 88.9% of the marks fell between 55 and 85 ( +3 SD) 3-27
(4) Coefficient of Variation The standard deviation of the observations divided by their mean. Population Coefficient of Variation Sample Coefficient of Variation CV provides a proportionatemeasure of variation (relative variability) 3-28
(5) Interquartile Range IQR = Third Quartile (Q3) – First Quartile (Q1) The interquartile range measures the spread of the middle 50% of the observations. Large values of IQR indicate that Q1 and Q3 are far apart, indicating a high level of variability. 3-29
Measures of Relative Standing Measures of relative standing are designed to provide information about the position of particular values relative to the entire data set. (1) Percentiles The pthpercentile is the value for which ppercent are less than that value and (100-p)% are greater than that value. Suppose you scored in the 60th percentile on the GMAT, that means 60% of the other scores were below yours, while 40% of scores were above yours. 3-30
(2) Quartiles The distribution of the data can also be divided into quartiles (fourths) First Quartile (Q1) = 25th percentile Second Quartile (Q2) = 50th percentile (median) Third Quartile (Q3) = 75th percentile Notes: The position of a value can also be determined via ogive. We can also convert percentiles into quintiles (fifths) and deciles (tenths). 3-31
If your exam mark places you in the third quartile (Q3), it doesn’t mean you scored 75% on the exam. But it indicates that 75% of your peers scored lower than you, while 25% of scores were higher than yours. Similarly, if your mark is in the second quartile (Q2 or median), that means 50% of the other scores were below yours, while 50% of scores were above yours. 3-32
Determining the Value of Percentile Lp determines the position in the data set where the percentile value lies, not the value of the percentile itself. To determine the value of a percentile, we need to first identify its location. 3-33
Illustration 10 Listed below are the commissions earned last month by a sample of 15 brokers at Salomon Smith Barney’s Oakland, California, office. $2,038 $1,758 $1,721 $1,637 $2,097 $2,047 $2,205 $1,787 $2,287 $1,940 $2,311 $2,054 $2,406 $1,471 $1,460 Determine the median (Q2=L50), the first quartile (Q1=L25), and the third quartile (Q3=L75) for the commissions earned. 3-34
Step 2: Determine the location of L25, L50 and L75 Step 1: Sort the data in ascending order $1,460 $1,471 $1,637 $1,721 $1,758 $1,787 $1,940 $2,038 $2,047 $2,054 $2,097 $2,205 $2,287 $2,311 $2,406 3-35
Step 3: Determine the value of L25, L50 and L75 Since n = 15 (odd), it is straightforward to identify the data in 4th, 8th and 12th position. The value of Q1 = $1,721 The value of Median = $2,038 The value of Q3 = $2,205 3-36
Illustration 11 You are given the following data 0 0 5 7 8 9 12 14 22 33 Determine the median (Q2=L50), the first quartile (Q1=L25), and the third quartile (Q3=L75). 3-37
0 0 5 7 8 9 12 14 22 33 Step 2: Determine the location of L25, L50 and L75 Step 1: Sort the data in ascending order 3-38
Step 3: Determine the value of L25, L50 and L75 0 0 5 7 8 9 12 14 22 33 Position 2.75 Q1 is 0.75 of the distance between the second (which is 0) and the third (which is 5) observations. 0.75 of the distance is: (0.75)(5 – 0) = 3.75 Because the second observation is 0, then: Q1 = 0 + 3.75 = 3.75 3-39
0 0 5 7 8 9 12 14 22 33 Position 5.5 Q2 (Median) is 0.5 of the distance between the fifth (which is 8) and the sixth (which is 9) observations. 0.5 of the distance is: (0.5)(9 – 8) = 0.5 Because the fifth observation is 8, then: Q2 = 8 + 0.5 = 8.5 3-40
0 0 5 7 8 9 12 14 22 33 Position 8.25 Q3 is 0.25 of the distance between the eighth (which is 14) and the ninth (which is 22) observations. 0.25 of the distance is: (0.25)(22 – 14) = 2 Because the eighth observation is 14, then: Q3 = 14 + 2 = 16 3-41
Measures of Linear Relationship (1) Covariance • When two variables move in the same direction (both increase or both decrease), the covariance will be a large positive number. • When two variables move in opposite directions, the covariance is a large negative number. • When there is no particular pattern, the covariance is a small number. However, it is often difficult to determine whether a particular covariance is large or small. 3-42
Illustration 12 In each set, the values of X are the same, and the value for Y are the same; the only thing that’s changed is the order of the Y’s. In set #1, as X increases so does Y; Sxy is large & positive In set #2, as X increases, Y decreases; Sxy is large & negative In set #3, as X increases, Y doesn'tmove in any particular way; Sxy is “small” 3-44
(2) Coefficient of Correlation Greek letter “rho” This coefficient answers the question: How strong is the association between X and Y? 3-45
+1 0 -1 Strong positive linear relationship r or r = No linear relationship Strong negative linear relationship 3-46
Illustration 12 Calculate the correlation of coefficient for the above three data sets. Because we have already calculated the covariance, we only need to compute the standard deviations of X and Y. 3-47
The coefficients of correlation are: Set 1: Set 2: Set 3: 3-49
(3) Coefficient of Determination The Square of the coefficient of correlation • When we introduced the coefficient of correlation, we pointed out that except for −1, 0, and +1, we cannot precisely interpret its meaning. • We can judge the coefficient of correlation in relation to its proximity to −1, 0, and +1 only. • Fortunately, the correlation of coefficient (R2) provides us another measure that can precisely interpret the strength of relationship. • R2 measures the amount of variation in the dependent variable (Y) that is explained by the variation in the independent variable (X). 3-50