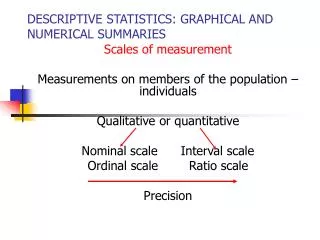
Exploring Frequency Distributions: Analyzing Data Sets with Histograms
This guide provides guidelines for creating frequency distributions and histograms to analyze data sets effectively. Learn how to select classes and widths, interpret relative frequencies, and identify modal classes in histograms. Explore graphical techniques and interpret distributions for better data insights.


Exploring Frequency Distributions: Analyzing Data Sets with Histograms
E N D
Presentation Transcript
Frequency Distribution • Guidelines for Selecting Number of Classes • Use between 5 and 20 classes. • Data sets with a larger number of elements usually require a larger number of classes. • Smaller data sets usually require fewer classes.
Frequency Distribution • Guidelines for Selecting Width of Classes • Use classes of equal width. • Approximate Class Width =
Example: Hudson Auto Repair The manager of Hudson Auto would like to get a better picture of the distribution of costs for engine tune-up parts. A sample of 50 customer invoices has been taken and the costs of parts, rounded to the nearest dollar, are listed below.
Example: Hudson Auto Repair • Frequency Distribution If we choose six classes: Approximate Class Width = (109 - 52)/6 = 9.5 10 Cost ($)Frequency 50-59 2 60-69 13 70-79 16 80-89 7 90-99 7 100-109 5 Total 50
Example: Hudson Auto Repair • Relative Frequency and Percent Frequency Distributions Relative Percent Cost ($)FrequencyFrequency 50-59 .04 4 60-69 .26 26 70-79 .32 32 80-89 .14 14 90-99 .14 14 100-109 .1010 Total 1.00 100
Example: Hudson Auto Repair • Insights Gained from the Percent Frequency Distribution • Only 4% of the parts costs are in the $50-59 class. • 30% of the parts costs are under $70. • The greatest percentage (32% or almost one-third) of the parts costs are in the $70-79 class. • 10% of the parts costs are $100 or more.
Graphical Techniques for Interval Data • Example 1: Providing information concerning the monthly bills of new subscribers in the first month after signing on with a telephone company. • Collect data • Prepare a frequency distribution • Draw a histogram
Class width = [Range] / [# of classes] [119.63 - 0] / [8] = 14.95 15 Example 1: Providing information Collect data Prepare a frequency distribution How many classes to use? Number of observations Number of classes Less then 50 5-7 50 - 200 7-9 200 - 500 9-10 500 - 1,000 10-11 1,000 – 5,000 11-13 5,000- 50,000 13-17 More than 50,000 17-20 (There are 200 data points Smallest observation Largest observation Largest observation Largest observation Largest observation Smallest observation Smallest observation Smallest observation
Draw a Histogram Example 1: Providing information
Example 1: Providing information What information can we extract from this histogram? Relatively, large number of large bills About half of all the bills are small A few bills are in the middle range 71+37=108 13+9+10=32 80 18+28+14=60 60 Frequency 40 20 0 15 45 75 30 60 90 105 120 Bills
Class frequency Total number of observations Class relative frequency = Relative frequency • It is often preferable to show the relative frequency (proportion) of observations falling into each class, rather than the frequency itself. • Relative frequencies should be used when • the population relative frequencies are studied • comparing two or more histograms • the number of observations of the samples studied are different
Class width • It is generally best to use equal class width, but sometimes unequal class width are called for. • Unequal class width is used when the frequency associated with some classes is too low. Then, • several classes are combined together to form a wider and “more populated” class. • It is possible to form an open ended class at the higher end or lower end of the histogram.
Shapes of histograms Symmetry • There are four typical shape characteristics
Shapes of histograms Skewness Negatively skewed Positively skewed
Modal classes A modal class is the one with the largest number of observations. A unimodal histogram The modal class
Modal classes A bimodal histogram A modal class A modal class
Bell shaped histograms • Many statistical techniques require that the population be bell shaped. • Drawing the histogram helps us to verify the shape of the population in question
Interpreting histograms • Example 2: Selecting an investment • An investor is considering investing in one out of two investments. • The returns on these investments were recorded. • From the two histograms, how can the investor interpret the • Expected returns • The spread of the return (the risk involved with each investment)
The center for A The center for B Example 2 - Histograms 18- 16- 14- 12- 10- 8- 6- 4- 2- 0- 18- 16- 14- 12- 10- 8- 6- 4- 2- 0- -15 0 15 30 45 60 75 -15 0 15 30 45 60 75 Return on investment A Return on investment B Interpretation:The center of the returns of Investment Ais slightly lower than that for Investment B
17 16 26 34 43 46 Example 2 - Histograms Sample size =50 Sample size =50 18- 16- 14- 12- 10- 8- 6- 4- 2- 0- 18- 16- 14- 12- 10- 8- 6- 4- 2- 0- -15 0 15 30 45 60 75 -15 0 15 30 45 60 75 Return on investment A Return on investment B Interpretation:The spread of returns for Investment Ais less than that for investment B
Example 2 - Histograms 18- 16- 14- 12- 10- 8- 6- 4- 2- 0- 18- 16- 14- 12- 10- 8- 6- 4- 2- 0- -15 0 15 30 45 60 75 -15 0 15 30 45 60 75 Return on investment A Return on investment B Interpretation:Both histograms are slightly positively skewed. There is a possibility of large returns.
Providing information • Example 2: Conclusion • It seems that investment A is better, because: • Its expected return is only slightly below that of investment B • The risk from investing in A is smaller. • The possibility of having a high rate of return exists for both investment.
Interpreting histograms • Example 3: Comparing students’ performance • Students’ performance in two statistics classes were compared. • The two classes differed in their teaching emphasis • Class A – mathematical analysis and development of theory. • Class B – applications and computer based analysis. • The final mark for each student in each course was recorded. • Draw histograms and interpret the results.
Interpreting histograms The mathematical emphasis creates two groups, and a larger spread.
STRIP PLOTS • A strip chart is the most basic type of plot available. It plots the data in order along a line with each data point represented as a box. In R: > stripchart(data) There is no title nor axes labels. It only shows how the data looks if you were to put it all along one line and mark out a box at each point. If you would prefer to see which points are repeated you can specify that repeated points be stacked: stripchart(data,method=stacked)
Stem and Leaf Display • This is a graphical technique most often used in a preliminary analysis. • Stem and leaf diagrams use the actual value of the original observations (whereas, the histogram does not).
Stem-and-Leaf Display • A stem-and-leaf display shows both the rank order and shape of the distribution of the data. • It is similar to a histogram on its side, but it has the advantage of showing the actual data values. • The first digits of each data item are arranged to the left of a vertical line. • To the right of the vertical line we record the last digit for each item in rank order. • Each line in the display is referred to as a stem. • Each digit on a stem is a leaf. 8 5 7 9 3 6 7 8
Stem-and-Leaf Display • Leaf Units • A single digit is used to define each leaf. • In the preceding example, the leaf unit was 1. • Leaf units may be 100, 10, 1, 0.1, and so on. • Where the leaf unit is not shown, it is assumed to equal 1.
Example: Leaf Unit = 0.1 If we have data with values such as 8.6 11.7 9.4 9.1 10.2 11.0 8.8 a stem-and-leaf display of these data will be Leaf Unit = 0.1 8 6 8 9 1 4 10 2 11 0 7
Example: Leaf Unit = 10 If we have data with values such as 1806 1717 1974 1791 1682 1910 1838 a stem-and-leaf display of these data will be Leaf Unit = 10 16 8 17 1 9 18 0 3 19 1 7
Observation: Stem Leaf 42 19 Stem Leaf 4 2 Stem and Leaf Display • Split each observation into two parts. • There are several ways of doing that: 42.19 42.19 A stem and leaf display forExample 1 will use thismethod next.
Stem and Leaf Display • A stem and leaf display for Example 1Stem Leaf0 0000000000111112222223333345555556666666778888999999 1 000001111233333334455555667889999 2 0000111112344666778999 3 001335589 4 124445589 5 33566 6 3458 7 022224556789 8 334457889999 9 00112222233344555999 10 001344446699 11 124557889 The length of each linerepresents the frequency of the class defined by the stem.
1.000 .930 .790 .700 .650 60 75 90 105 120 Ogives • Ogives are cumulative relative frequency distributions. • Example 1 - continued } } .605 .540 .355 15 30 45
Summarizing Qualitative Data • Frequency Distribution • Relative Frequency • Percent Frequency Distribution • Bar Graph • Pie Chart
Frequency Distribution • A frequency distribution is a tabular summary of data showing the frequency (or number) of items in each of several nonoverlapping classes. • The objective is to provide insights about the data that cannot be quickly obtained by looking only at the original data.
Example: Marada Inn Guests staying at Marada Inn were asked to rate the quality of their accommodations as being excellent, above average, average, below average, or poor. The ratings provided by a sample of 20 quests are shown below. Below Average Average Above Average Above Average Above Average Above Average Above Average Below Average Below Average Average Poor Poor Above Average Excellent Above Average Average Above Average Average Above Average Average
Example: Marada Inn • Frequency Distribution
Relative Frequency Distribution • The relative frequency of a class is the fraction or proportion of the total number of data items belonging to the class. • A relative frequency distribution is a tabular summary of a set of data showing the relative frequency for each class.
Percent Frequency Distribution • The percent frequency of a class is the relative frequency multiplied by 100. • Apercent frequency distribution is a tabular summary of a set of data showing the percent frequency for each class.
Example: Marada Inn Relative Frequency and Percent Frequency Distributions
Graphical Techniques for Nominal data • The only allowable calculation on nominal data is to count the frequency of each value of a variable. • When the raw data can be naturally categorized in a meaningful manner, we can display frequencies by • Bar charts – emphasize frequency of occurrences of the different categories. • Pie chart – emphasize the proportion of occurrences of each category.
The Pie Chart • The pie chart is a circle, subdivided into a number of slices that represent the various categories. • The size of each slice is proportional to the percentage corresponding to the category it represents.
Pie Charts • The pie chart is a commonly used graphical device for presenting relative frequency distributions for qualitative data. • First draw a circle; then use the relative frequencies to subdivide the circle into sectors that correspond to the relative frequency for each class. • Since there are 360 degrees in a circle, a class with a relative frequency of .25 would consume .25(360) = 90 degrees of the circle.
Example: Marada Inn • Pie Chart
Example: Marada Inn • Insights Gained from the Preceding Pie Chart • One-half of the customers surveyed gave Marada a quality rating of “above average” or “excellent” (looking at the left side of the pie). This might please the manager. • For each customer who gave an “excellent” rating, there were two customers who gave a “poor” rating (looking at the top of the pie). This should displease the manager.
The Pie Chart • Example 4 • The student placement office at a university wanted to determine the general areas of employment of last year school graduates. • Data were collected, and the count of the occurrences was recorded for each area. • These counts were converted to proportions and the results were presented as a pie chart and a bar chart.
The Pie Chart Other 11.1% (28.9 /100)(3600) = 1040 Accounting 28.9% General management 14.2% Finance 20.6% Marketing 25.3%
Pie Charts • Advantages • display relative proportions of multiple classes of data • size of the circle can be made proportional to the total quantity it represents • summarize a large data set in visual form • be visually simpler than other types of graphs • permit a visual check of the reasonableness or accuracy of calculations • require minimal additional explanation • be easily understood due to widespread use in business and the media • Disadvantages • do not easily reveal exact values • Many pie charts may be needed to show changes over time • fail to reveal key assumptions, causes, effects, or patterns • be easily manipulated to yield false impressions