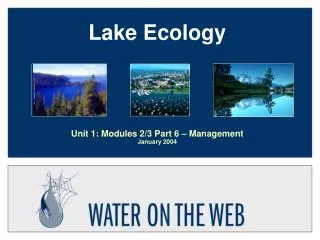
Lake Ecology
Lake Ecology. Unit 1: Modules 2/3 Part 6 – Management January 2004. Modules 2/3 overview. Goal – Provide a practical introduction to limnology Time required – Two weeks of lecture (6 lectures) and 2 laboratories

Lake Ecology
E N D
Presentation Transcript
Lake Ecology Unit 1: Modules 2/3 Part 6 – ManagementJanuary 2004
Modules 2/3 overview • Goal – Provide a practical introduction to limnology • Time required – Two weeks of lecture (6 lectures) and 2 laboratories • Extensions – Additional material could be used to expand to 3 weeks. We realize that there are far more slides than can possibly be used in two weeks and some topics are covered in more depth than others. Teachers are expected to view them all and use what best suits their purposes.
Modules 2/3 outline • Introduction • Major groups of organisms; metabolism • Basins and morphometry • Spatial and temporal variability – basic physical and chemical patchiness (habitats) • Major ions and nutrients • Management – eutrophication and water quality
6. Management topics • Trophic status • Eutrophication • Water quality
Phosphorus Essential for growth PO4-3 is primary dissolved form PO4-3 sticks to soil and sediment particles Usually key nutrient for triggering excess plant growth Must be reduced to control eutrophication 1 lb (kg) P can yield 500 lbs (kg) fresh algae Nitrogen Essential for growth NO3-, NH4+, and N2 are primary biological forms NO3- soluble in water May limit algal growth in some circumstances More difficult to remove from wastewater than P Some forms are toxic or disease-causing to fish and mammals (including humans) Nutrients most limiting to algal growth
Limiting nutrients – demand versus supply • Nitrogen and phosphorus are typically in extremely short supply in water relative to plant demand • The “Redfield ratio” is the average composition of elements in phytoplankton • Ratio – 100DW:40C:7N:1P
The concept of limiting nutrients • Liebig’s Law of the Minimum (~1840): • An organism’s total biomass yield is proportional to the lowest concentration of nutrient relative to the requirements of that organism (paraphrased). • Lake managers are interested in limiting nutrients because: • An increase might change water quality or food webs. • Restoration often requires a strategy for reducing nutrient loading and predictions of the consequences of specific actions.
Limiting nutrients – a conceptual example • The following set of slides were developed to illustrate more specifically what is meant by “limiting nutrients” in the context of eutrophication studies • This may be appropriate for a lab exercise in which different combinations of N and P are added to lake water • Lake Superior was used as an example because we can see it out our window and because it is the biggest lake in the world and the cleanest of the Laurentian Great Lakes, so it is important to understand
Minnesota Sea Grant • Dave Hansen • Dave Hansen • Dave Hansen Example – loosely based on Lake Superior
Conceptual nutrient limitation bioassay – 1 This example is loosely based on Lake Superior 1. Algal composition is approximately: 500 g wet weight : 100 g dry weight : 40 g C : 7 g N : 1 g P Remember that the ratio of C:N:P is called the “Redfield ratio” and approximates the composition of algae! 40:7:1 by weight 100:16:1 by atoms
Conceptual nutrient limitation bioassay – 2 2. Mid-summer bioavailable water chemistry: • Dissolved inorganic carbon (DIC): • ~ 10,000 µg C/L (as carbon dioxide and bicarbonate) • Dissolved inorganic nitrogen (DIN): • ~ 300 µg N/L (95% as nitrate, with very low ammonium) • Dissoved inorganic phosphorus (ortho-P, DIP): ~ 0.5 µg P/L
Conceptual nutrient limitation bioassay – 3 3. Assume: • Algal biomass = B0 ~ 200 µg C/L (particulate) • Algal maximum growth rate ~ 20% per day
Control + Phosphorus + Nitrogen + Carbon Add nothing + 0.5 µg P/L + 10,000 µg C/L + 300 µg N/L Conceptual nutrient limitation bioassay – 4 4. Run a nutrient enrichment experiment to estimate the limiting nutrient by doubling each nutrient: • Set up 4 liter bottles of lake water in triplicate: • Incubate for 1 day and re-measure algal biomass (Bf)
Conceptual nutrient limitation bioassay – 5 5. What happens? • After 1 day – algae grow 20% X 200 µg C/L = + 40 µg C/L • Apply the “Redfield Ratio” to estimate nutrient needs • Is there sufficient DIC to support this much growth? • Is there sufficient DIN to support this much growth? • Is there sufficient DIP to support this much growth?
Conceptual nutrient limitation bioassay – 6 6. What happened? • 40 µg C/L of new growth would require: • 40 µg DIC/L + 7 µg DIN/L + 1 µg DIP/L +0 control treatment: • 10,000 µg DIC/L is much more than enough • 300 µg DIN/L is more than enough (293 excess) • 0.5 µg DIP/L is half of what is needed Therefore growth is 50% of maximum: = +20 µg C/L
Conceptual nutrient limitation bioassay – 6 6. What happened? • 40 µg C/L of new growth would require: • 40 µg DIC/L + 7 µg DIN/L + 1 µg DIP/L +N treatment: • 10,000 µg DIC/L is much more than enough • 600 µg DIN/L is more than enough (593 excess) • 0.5 µg DIP/L is half of what is needed Therefore growth is 50% of maximum = +20 µg C/L
Conceptual nutrient limitation bioassay – 6 6. What happened? • 40 µg C/L of new growth would require: • 40 µg DIC/L + 7 µg DIN/L + 1 µg DIP/L +C treatment: • 20,000 µg DIC/L is much more than enough • 300 µg DIN/L is more than enough (293 excess) • 0.5 µg DIP/L is half of what is needed Therefore growth is 50% of maximum = +20 µg C/L
Conceptual nutrient limitation bioassay – 6 6. What happened? • 40 µg C/L of new growth would require: • 40 µg DIC/L + 7 µg DIN/L + 1 µg DIP/L +P treatment: • 10,000 µg DIC/L is much more than enough • 300 µg DIN/L is more than enough (293 excess) • 1.0 µg DIP/L is just what is needed Therefore growth is 100% of maximum = +40 µg C/L
200 % 100 % 0 % +0 +C +N +P Nutrient bioassay – summary and plot • An enrichment of only 0.5 µg P/L doubled algal growth • It would take a depletion of 43 µg P/L to deplete the 300ug DIN/L, based on the 7:1 ratio • The DIC is virtually inexhaustible in all lakes. • It may “briefly” limit algal growth in hypereutrophic sewage oxidation ponds • The data suggest strong P-limitation for Lake Superior
Real data from the epilimnia of pristine northern Minnesota lakes Theory Nutrient limitation bioassay responses • In progress, 10/20/03
Halsteds Bay late summer mixing events • What might this mean for phosphorus levels in the water column? • Why?
Medicine Lake– Algal blooms & mixing events - 1 Background: • Medicine Lake is extremely productive because of historically high nutrient enrichment from its watershed (go to http://lakeaccess.org/lakedata/lawnfertilizer/mainlawn.htm) • Major blooms of algae can be detected in the RUSS data set as: • supersaturated O2 (why ?) • increased pH (why ?) • increased chlorophyll-a or turbidity (why ?)
Saturday Thursday Sunday Friday-midnight Medicine Lake – Algal blooms & mixing events-2 Color = O2 Line = pH STRATIFY RE- STRATIFY MIX MIX
Halsteds Bay – Algal blooms & mixing events- 3 Why did the phosphorus in the bottom water drop so dramatically in August 1999 in Halsteds Bay ? P levels drop
Halsteds Bay – Algal blooms & mixing events- 4 First, focus on the ice-free season water quality • relatively high epilimnion (surface)TP ~ 75-150 ugP/L • chlor-a (algae ) builds up steadily to levels > 50 ug/L
Halsteds Bay – Algal blooms & mixing events- 5 See how secchi drops as chlorophyll increases ?
Halsteds Bay – Algal blooms & mixing events- 6 Now see how much TP is in the hypolimnion
Halsteds Bay – Algal blooms & mixing events- 7 Summary slide without animation
C Medicine Lake: Storm mixing events • This sequence runs from 1-5 from Aug 29-30, 1999
Trophic status classification • This topic will be developed further in Module 22 (Regulations and Compliance Monitoring - Lake Biocriteria) • Managers need to classify lakes to set water quality standards and prioritize monitoring, research, and restoration $$. • Lake productivity, as indicated by its production of algal biomass, is a useful classification in regard to water quality issues as well as fisheries management • Trophic status indices usually assume that nutrient levels (e.g. total-P) control algal biomass (measured by chlorophyll-a) which in turn regulates lake clarity (Secchi disk transparency)
Trophic Status • Carlson trophic state index (TSI)- most widely used • based on log transformation of Secchi disk values as a measure of algal biomass on a scale from 0 – 110 • 10 units = doubling of algal biomass • TSI’s also developed for chlor-a and total-P based on their relationships to secchi for a set of midwestern lakes • TSI useful for comparing lakes within a region and for assessing changes in trophic status over time • Time period: usually summer; often set at June 15 – Sep 15 but it is rarely a good idea to restrict data acquisition without a good reason – especially Volunteer secchi data
Carlson TSI equations • TSI-S = 60 - 14.41 ln [Secchi disk, m] • TSI-C = 9.81 ln [Chlor-a, µg/L] + 30.6 • TSI-P = 14.42 ln [TP, µg/L] + 4.15 • Average TSI = [TSI-P + TSI-C + TSI-S] / 3 • If the 3 TSI values are not similar to each other, it is likely that: • algae may be light- or nitrogen-limited instead of P-limited, or • secchi is affected by erosional silt rather than by algae, or something else. One should look deeper into the data! • Note that Dr. Carlson recommended not averaging the 3 values to avoid obscuring important differences
Oligotrophic Mesotrophic Eutrophic Hypereutrophic TSI (Carlson) - graphical
What are Ecoregions ? • Areas with similar: • Climate • Landuse • Soils • Topography • “Potential” natural vegetation • Minnesota has seven major ecoregions • Four ecoregions contain most of the lakes • Water quality varies greatly from south to north
1.0-3.3 ft 8-15 ft 5-11 ft 1.6-3.3 ft
TSI Trends in Minneapolis, MN area WOW Lakes Note importance of flagging which TSI is plotted and leaving space for missing years Solid bars:TSI average for TP, chlor and secchi; striped: secchi only How would you determine how well the TSI- secchi alone (stripes) predicts average TSI or TSI- chlor ?
Log chlor-a vs Log TP scatterplot for Minnesota’s ecoregion reference lakes (summer mean surface values) Secchi transparency vs TP for Minnesota’s ecoregion reference lakes (summer mean surface values) Chlor-a - TP and Secchi – TP relationships in MN Notice that lake clarity is much more sensitive to increased phosphorus at the low end of the scale. Why ? Data from Minnesota Pollution Control Agency Year 2000 Lake Assessment report (www.pca.state.mn.us)
Ex: Halsteds Bay late summer mixing events • Run the color mapper from April 1999 through 2002 focusing on storm events in mid August 1999 and 2000 • START with MAP = TEMP and plot =DO to show variable stratification • Then switch to MAP = DO and PLOT = TEMP to show anoxic events and discuss the release of P from sediments that swamps annual P-inflow from the watershed
Hypolimnion responses to anoxia As the hypolimnion becomes O2 –depleted: • NH4+ accumulates • increased organic matter is decomposing • cannot be converted to NO3- without 2 (bacterial nitrification) • not much algal uptake (its dark and anoxic) • Insoluble oxidized Fe+3 (ferric) at sediment surface is reduced to Fe +2 (ferrous) that is soluble; the phosphate adsorbing layer dissolves • PO4-3diffusion from the sediments increases dramatically • Increasing decomposition leads to strong reducing conditions that favor bacterial reduction of sulfate to sulfide - producing rotten egg gas (H2S) • Mixing adds lots of available N + P to the sunlit zone = ALGAE !!
Trophic (feeding metabolism) terminology Oligotrophic – low nutrients and “productivity;” usually high clarity Mesotrophic – moderate nutrients, “productivity” and clarity Eutrophic – high nutrients and “productivity;” low clarity
Eutrophication – Excess fertility leading to excessive plant growth
Water Quality Impacts- Eutrophication (some of them) • excess algae: scums, noxious blue-greens, taste/odor/smell • O2 depletion; loss of fish habitat • loss of clarity (secchi depth); aesthetic loss; • excess macrophyte (“weed”) growth- loss of open water; favors exotic species (EWM); sediment destabilization • game fish impacts
Water Quality Impacts- Eutrophication (…and some more) • loss of native macrophytes from algal shading; loss of fish & waterfowl habitat and food; reduced shoreline & bottom stabilization, increased erosion • lower bottom O2: increased sediment nutrient release: loss of fish habitat • excess organic matter: smothers eggs and bugs
Eutrophication – natural vs cultural • Natural filling by mineral and organic sediment – leads to lower V and larger Aw:A0 and A0:V • Lake to wetland conversion • Time scale > 103 years (if at all) • Irreversible • Human-caused from excess nutrient inputs and poor land-use management • Water quality degraded; loss of beneficial uses • Time scale < decades • Reversible loading
Eutrophication – the sad Lake Tahoe story Data courtesy of C.R. goldman and J.E. Reuter, Tahoe Reesrach Group, U. of California-Davis, http://www.news.ucdavis.edu/tahoetv/