Experiments with Plants
130 likes | 281 Vues
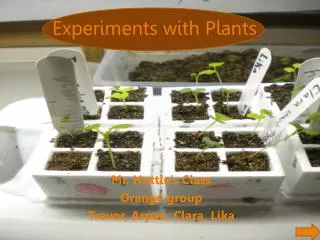
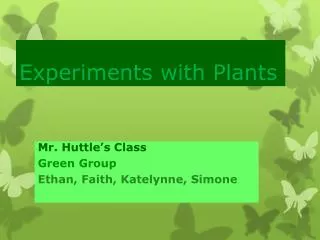
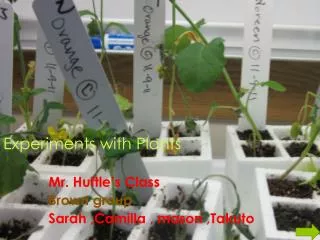
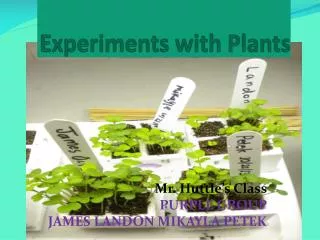
Experiments with Plants. Mr. Huttle’s Class PURPLE GROUP JAMES LANDON MIKAYLA PETEK. Wisconsin Fast Plants. Conclusion. Graph of Plant Growth: Control. Graph of Plant Growth: Test. Variable we tested (Manipulated). Sketch of flowering Plant. Sketch of fertilized Plant. Variables

Experiments with Plants
E N D
Presentation Transcript
Experiments with Plants Mr. Huttle’s Class PURPLE GROUP JAMES LANDON MIKAYLA PETEK
Wisconsin Fast Plants Conclusion Graph of Plant Growth: Control Graph of Plant Growth: Test Variable we tested (Manipulated) Sketch of flowering Plant Sketch of fertilized Plant Variables Not Changed (Controlled) Sketch of worker bee Illustration of interdependence between flowering plants and bees How we tested the variable (Responding)
History of the Wisconsin Fast Plant I study plant diseases. • Wisconsin Fast Plants is a unique member of the plant world. They can sprout leaves, develop buds, flowers, produce pods with seeds and die within 6 weeks. All of this is possible thanks to Dr.Williams, who is a professor and researcher at the University of Wisconsin. It took him 15 years to develop the Wisconsin Fast Plants and speed up their life cycle. He wanted to do this, because he’s a plant pathologist and his job is to study plant diseases and find out if some plants can inherit the ability to get rid of diseases. To do this, he made a world collection of more than 2,000 Brassica seeds. The Brassica seeds need water, light, fertilizer, space, pollination and temperature. Dr.Williams, the plant pathologist
Variable we tested (Manipulated) The variable we tested was space. • Our group decided to do space because we were curious about if the plants would grow around each other. If the plants are bunched together then it would start to collide into each other, but in the article it says, “Fast plants for fast times.” It said the Wisconsin fast plant can grow in small places. Our group thought it wouldn’t grow nearly up as tall as the controlled plants. We were thinking that the plants might grow taller in order to get enough light, and develop more buds and pods. To change the space we put in 15 seeds. I will know this is a far test by not changing any other variables like light, fertilizer, pollination, temperature, and water.
Variables Not Changed (Controlled) Water Light Fertilizer Temperature Pollination The variables we didn’t change were water, light, fertilizer, temperature, and pollination. We weren’t allowed to change water, temperature, or pollination even if we wanted to. In order for our Wisconsin Fast Plants to grow, they need 24 hours of water and temperature. We had to have pollination for our plants’ flowers to bloom. We didn’t change light, because light is an important part of plants’ growth, and we didn’t want to remove any light from our plants’ view. Without light, our plants couldn’t be able to do photosynthesis. We didn’t want to change fertilizer, because that would affect how healthy our plants would be. Usually, we need to put 3 fertilizer pellets in each of our plant quads. Our plants will be able to get all the nutrients they need, so their leaves will sprout healthy and green. By increasing or decreasing the number of pellets, then our plants might get droopy, or get too much nutrients, and we didn’t want that to happen either.
How we tested the variable (Responding) Our tested variable is space. • Usually, in every plant quad, you put only one seed in each one, because then the Brassica plant then has enough space to spread out and grow healthy. Instead, we decided to put 15 seeds in plant quad. We wanted to do this, to see if plants would start growing around each other in order to get enough light. At first, only about six or seven plants sprouted, but as they grew taller, all the seeds in each quad grew. Some plants were flattened out by other taller plants, so they couldn’t continue to grow. As the plants got taller, they started fighting for light because there were so many of them, and they needed their own space. Some plants started drooping and yellowed and blackened. In the end, the tallest plant of the two test cells was 3.5 inches.
Graph of Plant Growth: Control Plants As you can see on the graph, our control plants grew about 0.5 cm on the first day. They only had four leaves at the start. The next day, the plants had grown to 2 cm, but still had four leaves. For the next three days, the control plants remained at 3 cm, only 1 cm higher than day two. This time the plants had grown about eight leaves. On day six, the plants had grown to 5 cm, and had started developing buds. Each plant had about 6 buds, and about 3 buds had started blooming into yellow flowers.. On day seven, the control plants were at 6 cm, and each plant had about 6 flowers. On day eight, the control plants had grown all the way to 9 cm and were developing seed pods, and on day 9, the plants were about 10 cm. Our group concludes that our control plants were able to finish their cycle.
Graph of Plant Growth: Test Plants Our test plants started at about 2 cm, and the total leaves of all of the plants (15 plants) was 25. On day 2, the average measurement of our plants was 4 cm. Not all of our plants had grown yet in the test cells. This was the same for day 3. On day 4, the average measurement was 5.5 cm. The total number of leaves in each test cell was about 20. For day 5, the height was about 7 cm. The plants had started drying slightly, probably because they couldn’t get enough light, because there was so many plants. On day 6, the average measurement was 9 cm, and there was about 40 leaves in each test cell, so the plants were getting enough light and water. Flowers had started blooming as well. There was about 18 flowers in each test cell. On day 7, the average height was 10 inches, and there was about 10 pods in each test cell. On day 8, the measurements were at 3.5 inches for the test plants. On day 9, the plants remained at 3.5 inches, and had really started drying out.
Sketch of flowering Plant The Brassica flower’s parts are needed for it to survive. The anther produces pollen. The pollen travels to the stigma in order for pollination, fertilization, and production of new seeds. The pollen grains are for the bee to pick up and transport from one flower to another. The filament is the stalk like section of the stamen. The pollen is on top of it. The petal is the outer part of the Brassica flower, and the ovary is the base of the pistil. It produces seeds. The pistil of the Brassica flower is made up of the stigma, style and ovary. The stamen is made up of the anther, filament and stigma. The stigma attracts pollen.
Sketch of fertilized Plant The picture on the right shows a fertilized Brassica flower. Its buds have bloomed and the pods have grown. The petals have opened. This has happened because of pollination. The bee is attracted to the pollen and nectar of the Brassica flower. The flower gives the bee pollen and the flower has gotten pollen from the bee in order to form seed pods. The flower needs pollination to occur in order for it to survive, and the bee needs pollen for its nectar and hive.
Sketch of worker bee The worker bee is a female and is the smallest in size of the three types of bees. Their life span is 3 to 6 weeks. Workers make up about 90% of the hive. The jobs they do include: Feeding larvae. Building, cleaning, and guarding hive. Making wax. Controlling temperature in hive. Collecting nectar and pollen. The body of the worker bee is adapted for collecting food. Their long tongues collect nectar from deep inside flowers. The nectar is then stored in a “honey stomach” to transport back to the hive. The workers’ body is hairy and traps pollen into a “basket” on its hind legs and carries it back to the hive.
Illustration of interdependence between flowering plants and bees • A bee comes to a flower, then it collects pollen. The pollen sticks on the bee, and the bee puts it in their “basket”, which is on its hind legs. The bee then goes to another flower, and the pollen on the bee drops off on the new flower to make seeds. This is called cross pollinating . Interdependence is when a bee and the Brassica plant depends on each other to survive. The bee helps the plant produce seeds so that a whole new generation of plants can grow. The flower gives the bee nectar and pollen for the bee’s hive, and the bee drops off pollen at other flowers. It is very important that the pollen from one plant be transferred to a the stigma of another flower on another plant.
Conclusion The tested variable (space), affected the growth of the control vs. test plants. When we first planted the 15 seeds in the test cells and 1 seed in each control cell, the control cell plants grew smaller than the test plants. The test plants were 2.3 cm and the control plants were 1 cm. As the plants got taller, the test plants still remained taller than the control. In the end, the test plants were 10 cm and the control were 8.5 cm. We conclude that the more seeds we put in the test cells, the more higher they grew than the control plants. The comparisons between the control and test plants were that the test plants grew taller than the control plants. The test plants were always higher by about 2 cm. Also, the test plants were the first ones to start to dry out. The control remained green as the test cells yellowed and blackened. We think this is because there were too many plants in the test cell and they were all fighting for light, so the ones that remained at the bottom dried out. We conclude that based on our observations, there were many differences between the control and test plants. The things our group learned about the system of a plant is that they have a lot of parts for many different purposes, such as the abdomen, petals, and pollen grains. Each part helps the plant for a different reason. Also, the six main things plants need the most to survive and grow are water, light, space, fertilizer, pollination, and temperature. In conclusion, the Brassica plants system has a lot of parts to survive, and needs interdependence to survive, form seed pods and start a new generation of plants.