Download
1 / 29
290 likes | 293 Vues
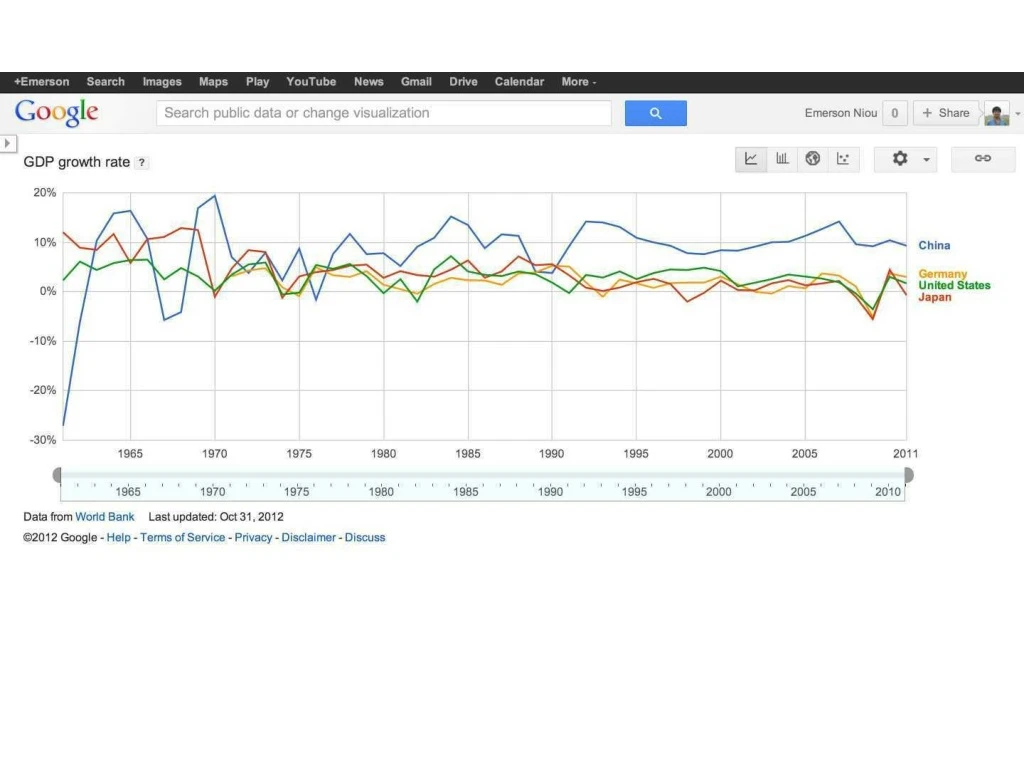
This text provides a historical overview of China's economic development from 1949 to present, including key milestones such as recovery and nationalization, infrastructure development, industrialization, the Great Leap Forward, the Cultural Revolution, and Deng's reforms. It also addresses income inequality and the transition towards market socialism.

E N D
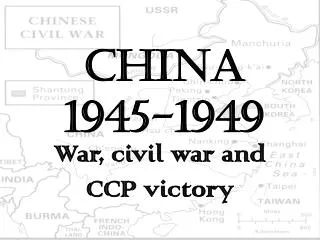
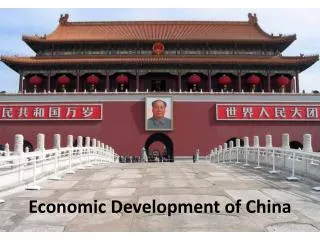
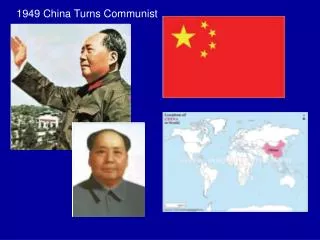
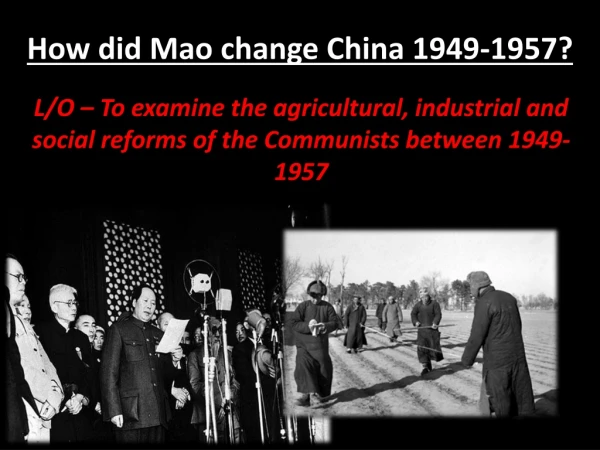
Economic Development in China 1949-1957 Recovery and Nationalization 1953-1957 Infrastructure Development 1957-1966 Industrialization and Collectivation Great leap forward People’s Commune 1966-76 China in Chaos: the Cultural Revolution
1978-1985 Market Socialism - Socialism with Chinese Characteristics To liberate the productive energies of the individual, Deng’s reforms abolished the communes and replaced them with a contract system. Peasants are free to grow what they wish and to start private businesses. “It does not matter whether a cat is black or white so long as it catches mice.” 摸着石头过河 to feel the rocks on the riverbed as one crosses the river; to figure things out as one goes; to take things one step at a time
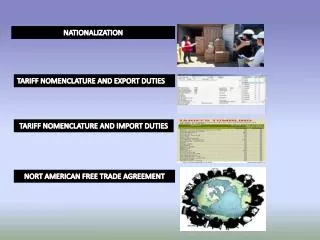
1985-1992 Balancing between • central planning and competitive markets: requiring the managers of state-owned enterprises to behave like profit-hungry, innovative capitalists. • state ownership and private property • political dictatorship and limited economic and cultural freedom • 1992 Market Economy
Average disposable annual income for Chinese urban residents in 2012 was the equivalent of about $4,000, an increase of 9.6 percent after taking inflation into account. Average rural net income was just under $1,300 per person, a rise of 10.7 percent after adjusting for inflation, the Chinese National Bureau of Statistics announced in January. The bureau also said that in 2012 China’s Gini coefficient, a widely used index of income inequality, was 0.474 (.61), slightly higher than levels of inequality in the United States, where income disparity now stands as one of the highest among advanced industrial nations.
The Gini coefficient (also known as the Gini index or Gini ratio) is a measure of statistical dispersion intended to represent the income distribution of a nation's residents. It was developed by the Italian statistician and sociologist CorradoGini and published in his 1912 paper "Variability and Mutability" (Italian: Variabilità e mutabilità).
The Gini coefficient is usually defined mathematically based on the Lorenz curve, which plots the proportion of the total income of the population (y axis) that is cumulatively earned by the bottom x% of the population (see diagram). The line at 45 degrees thus represents perfect equality of incomes. The Gini coefficient can then be thought of as the ratio of the area that lies between the line of equality and the Lorenz curve (marked A in the diagram) over the total area under the line of equality (marked A and B in the diagram); i.e., G = A / (A + B).
Analyzing the Problem The most common method of analyzing economic distribution is to use the family as the basic income unit and then rank all families from lowest to highest. After the incomes are ranked, they are then divided into fifths, and then examined. This data is then plotted on the Lorenz curve- a curve that shows how much the actual distribution of income varies from an equal distribution- by adding the percentage the lowest fifth earned to that of the next highest fifth, and then plotted as the first point of the graph. This number is then added to the middle fifth and plotted as the second point. This process continues until the cumulative values of all fifths are plotted. If all families earned the same income then the graph for the Lorenz curve would be a diagonal line beginning in the lower left-hand corner and moving towards the upper right hand corner. But because all families don't receive the same income, the curve showing the actual income distribution is curved. Thus the area between the ideal diagonal line and the curve shows the degree of income inequality.
Rising income disparity is a source of concern to the government because it causes widespread discontent and social protest. For long-term economic prosperity, the country should find a way to balance the policy that “let a few people get rich first” and the classical beliefs in egalitarianism.
¥1500 3% ¥1500-4500 10% ¥4500-9000 20% ¥9000-35000 25% ¥35000-55000 30% ¥55000-80000 35% > $80000 45%
Income Inequality When Karl Marx began to hypothesize that an economic revolution would occur, one of his primary concerns was the unequal distribution of wealth. He saw a capitalist society where there was terrible inequality. A small amount of people possessed a high percentage of all the money and income. What this did was to create a larger and larger poor underclass. Marx theorized that this unequal division of wealth would eventually lead to a class revolution. In America about 5% of the people possess 95% of the wealth. This leads to certain problems, foremost among them poverty and income equality. All of this eventually leads to the problem of lack of spending in an economy.
Reasons for Income Inequality There are numerous amounts of reasons as to why incomes of various groups may be different. The first reason has to do with education. Some people have higher incomes than others do because they obtained a higher level of education. Thus they are put in better positions to get higher paying jobs that require higher levels of skills.
The second reason for income inequality has to do with the fact that some people hold more wealth than others and that the distribution of wealth is more uneven than that of income. This inequality gives the wealthy the advantage to send their children to expensive colleges and universities, and to set their children up in business so they can earn a better income.
Discrimination is another reason that there is an inequality with regards to income. Women may not be promoted to the higher positions in their business because of the "glass ceiling". Certain unions may deny immigrants or minorities membership o the grounds that certain groups are not fit for certain professions. Another factor that influences the distribution of income is the ability that some people possess. Professional athletes and popular performers all have natural abilities that allow them to earn more income.
Finally, another reason for differences in the distribution of income is the amount of monopoly power certain groups hold. Unions have considerable power and have been able to obtain higher wages for their members. Therefore these workers are more likely to earn higher wages than a person in the same profession who is not a union member is. For white-collar workers, monopoly power comes in the form of quotas placed on the number that can enter a profession. The American Medial Association, for example, has been successful in limiting the number of people in its profession by limiting enrollments in medical schools.
Not enough government revenues have been used for projects to improve people's livelihoods, such as education, healthcare, government-funded housing and social security. In 2011, only 30.6 percent of the country's fiscal revenues were used for such a welfare network, compared with 52 percent in the US and 63 percent in Japan the same year.
Richard Wilkinson: How economic inequality harms societies http://www.youtube.com/watch?v=cZ7LzE3u7Bw Derek Scissors on China Income Inequality http://www.youtube.com/watch?v=IuydrEcvMS8 http://www.socialstudieshelp.com/Eco_Income_Inequality.htm Joseph Stiglitz - The Price of Inequality, June 14, 2012. https://www.youtube.com/watch?v=gKOJqnAET9A&list=PLA82B13F460301C86
September 26, 1983 the Four Cardinal Principles--the socialist line, the dictatorship of the proletariat, the leadership of the Communist Party and Marxist-Leninist-Mao Thought