Download
1 / 12
120 likes | 333 Vues
A2 – Determining Limits of Functions Graphically. IB Math HL&SL - Santowski. (A) Review.

E N D
A2 – Determining Limits of Functions Graphically IB Math HL&SL - Santowski
(A) Review • To understand how functions can have limits at any given x value, we simply understand the idea that we are approaching a given x value from both the left side and right side and then simply making observations about how the function values (the y values) are behaving. • If the function value (y value) is the same as we approach the x value from both the right and the left, then we say that the function does indeed have a limiting value at that given x value.
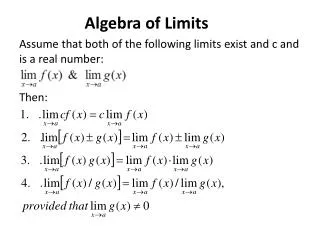
(B) Properties of Limits - Limit Laws • The limit of a constant function is the constant • The limit of a sum is the sum of the limits • The limit of a difference is the difference of the limits • The limit of a constant times a function is the constant times the limit of the function • The limit of a product is the product of the limits • The limit of a quotient is the quotient of the limits (if the limit of the denominator is not 0) • The limit of a power is the power of the limit • The limit of a root is the root of the limit
From the graph on this or the previous page, determine the following limits: (1) lim x-2 [f(x) + g(x)] (2) lim x-2 [(f(x))2 - g(x)] (3) lim x-2 [f(x) × g(x)] (4) lim x-2 [f(x) ÷ g(x)] (5) lim x1 [f(x) + 5g(x)] (6) lim x1 [ ½f(x) × (g(x))3] (7) lim x2 [f(x) ÷ g(x)] (8) lim x2 [g(x) ÷ f(x)] (9) lim x3 [f(x) ÷ g(x)] (C) Limits, Limit Laws, and Graphs
(A) Find function values at the following: (i) f(-10) = (ii) f(-4) = (iii) f(2) = (iv) f(7) = (D) Limits and Graphs
(D) Limits and Graphs • (B) Find the limit of the function f(x) from the previous slide at the following values: • (i) x = -10- and x = -10+ and so therefore, the limit of the function at x = -10 is • (ii) x = -6- and x = -6+ and so therefore, the limit of the function at x = -6 is • (iii) x = -4- and x = -4+ and so therefore, the limit of the function at x = -4 is • (iv) x = 0- and x = 0+ and so therefore, the limit of the function at x = 0 is • (v) x = 2- and x = 2+ and so therefore, the limit of the function at x = 2 is • (vi) x = 4- and x = 4+ and so therefore, the limit of the function at x = 4 is • (vii) x = 6- and x = 6+ and so therefore, the limit of the function at x = 6 is • (i) x = 7- and x = 7+ and so therefore, the limit of the function at x = 7 is • (i) x = 10- and x = 10+ and so therefore, the limit of the function at x = 10 is
(E) Graphs, GDC, and Limits • Now use a GDC to help you determine the following limits: • (i) • (ii) • (iii)
(F) One-Sided and Two-Sided Limits • In considering several of our previous examples, we see the idea of one and two sided limits. • A one sided limit can be a left handed limit notated as which means we approach x = a from the left (or negative) side • We also have right handed limits which are notated as which means we approach x = a from the right (or positive) side • We can make use of the left and right handed limits and now define conditions under which we say a function does not have a limiting y value at a given x value by again considering our various examples above, we can see that some of our functions do not have a limiting y value because as we approach the x value from the right and from the left, we do not reach the same limiting y value. • Therefore, if then does not exist.
(G) Internet Links • On-line quiz from Visual Calculus on Limit Theorems • Tutorial and Quiz from Harvey Mudd College on Computing Limits • Limits - One-Sided Limits - from Paul Dawkins at Lamar U • Visual Calculus - Numerical Exploration of Limits
(H) Homework • Stewart, 1989, Calculus – A First Course, Chap 1.2, p18, Q1 & Chap 1.3, p27, Q1-3,4,6,8,9