Habitat Group
Habitat Group. Lake Champlain Watershed Regional Risk Model. Daniel Levy Kelsey Pratt Tyler Lewis. Problem Statement & Objectives. Lake Champlain Basin Program identifies fifteen different watersheds. Designating watersheds. Identifying Important Habitats on Regional Scale

Habitat Group
E N D
Presentation Transcript
Habitat Group Lake Champlain Watershed Regional Risk Model Daniel Levy Kelsey Pratt Tyler Lewis
Problem Statement & Objectives • Lake Champlain Basin Program identifies fifteen different watersheds. • Designating watersheds. • Identifying Important Habitats on Regional Scale • Determining Ranking values and possible implementation of a Habitat Filter.
Watershed Determination There are three proposals that need to be considered: • Focusing on Hydrologic Units • Specific Stakeholder Identified Watersheds • Watershed Segments by State
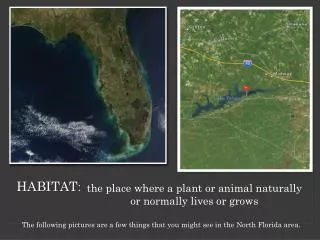
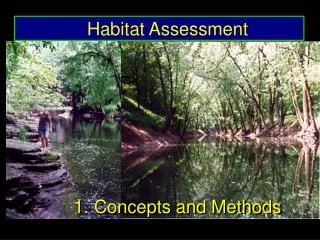
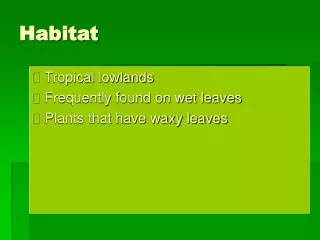
Identifying Important Habitats • Open water: • Lake Champlain • <6’ • >6’ • Lakes/Ponds other than Lake Champlain • Rivers and Streams • Developed: • Open space • Low intensity • Medium intensity • High intensity • Barren land (rock/sand/clay including mine pits and gravel sites) • Forest: • Deciduous • Coniferous • Mixed • Herbaceous: • Shrub • Grassland • Agriculture: • Pasture/hay • Cultivated crops • Wetlands: • Woody wetlands • Emergent herbaceous wetlands
Determining Ranking Values • Land Mass Ranking • Economic Ranking • Habitat Filter(s)
Habitat's Land Mass Ranking Values are Determined by the Ratio of Habitat Size : Watershed Size
Economic Rankings • Economic values are assigned to each habitat based on it's possible "Goods Value(s)". • Open Waters • Developed • Forest • Herbaceous • Agricultural • Wetlands Categories Retrieved from the Bureau of Economic Analysis:
Economic Uncertainty • When applying the GDP values for the state of New York, its metropolitan areas provided substantial economic stimuli, thus drastically inflating the State's values.
Habitat Stakeholder Importance Filter Enables local stakeholders to express the personal value that individual habitats are to them. Filter values are suggested to range between Zero and two : 0, 0.5, 1.0, 1.5, 2.0
Invasive and Endangered Species Limitations • Inflation in the rank would result if endangered species occurred, but was not continuous throughout the habitat type within the sub-basin. • Not assigning values would allow for stronger accuracy. • This approach could cause limitations when portraying highly “important” areas in each watershed. • Field research would have to be conducted.