Download
1 / 17
170 likes | 238 Vues
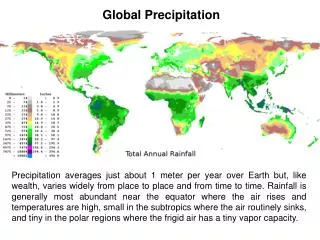
Reconstruction of Near-Global Precipitation Variations Thomas Smith 1 Phillip Arkin 2. 1. NOAA/NESDIS/STAR SCSB and CICS, College Park, Maryland 2. CICS/ESSIC/University of Maryland, College Park, Maryland. Precipitation Reconstructions Beginning 1900.

E N D
Reconstruction of Near-Global Precipitation VariationsThomas Smith1Phillip Arkin2 1. NOAA/NESDIS/STAR SCSB and CICS, College Park, Maryland2. CICS/ESSIC/University of Maryland, College Park, Maryland
Precipitation Reconstructions Beginning 1900 • Want to understand precipitation change with climate change • Need ocean-area precipitation anomalies • Satellite data for global analyses since 1979 • Defines statistical properties of anomalies • Gauges over land and islands since 1900 • For reconstructions with spatial covariance • EOFs define covariance (called REOF) • First regional-monthly REOF, later test global-annual REOF • Analyses of SST and SLP available since 1900 or earlier • For reconstructions using anomaly correlations between precip. and SST+SLP • CCA used (called RCCA), for global-annual analysis • Merging REOF and RCCA can give an improved reconstruction • Other improvements being developed and tested
REOF Method • Find historical time series for a set of covariance EOF maps • Covariance maps based on modern data (satellites) • Fit the historical data to the set of modes, minimize the error of the fit • Data, D, at spatial point, x, and time, t, is anomaly, a, minus a first guess REOF anomaly is first guess + weighted sum of covariance modes Best fit to get weighted sum, Minimizes squared error over spatial locations,
System of Equations For Best-Fit Weights Differentiate squared error w.r.t. each weight System of equations to solve to get the best-fit weights: • Screen out modes not adequately sampled • Cross validation used to tune number of modes & screening parameters • Can use since monthly anomalies are approximately normal
REOF Data Monthly Gauge Historical Analyses • Global Historical Climatology Network (GHCN) • Longest record, least filling • Global Precipitation Climatology Center (GPCC) • Used in GPCP modern analysis • Climate Research Unit (CRU) • Shortest record, most filling • Gauge-Satellite: Global Precipitation Climatology Project (GPCP) • Merges GPCC gauges and multi-satellite estimates • Global-monthly analysis since 1979, used for statistics
Against SOI REOF Climate-Mode Regressions: Consistent Interannual Variations Against NAO (Dec-Mar)
REOF Spatial Standard Deviation • Global spatial standard deviation • Similar interannual changes, REOF(GHCN) lower before 1940 (sampling) • REOF(CRU) strong most of record, blended with REOF(GPCP) and used in merged analysis
Reconstructions Using CCA (RCCA) • REOF interannual variations consistent, but multi-decadal variations less consistent • Annual Canonical Correlation Analysis (CCA) to reconstruct longer-period variations • Fields of predictors (SST and SLP anomalies) correlated with a predictand field (precipitation anomalies) • Train CCA using GPCP data and SST+SLP analyses • RCCA to reconstruct annual-average global anomalies beginning 1900 • RCCA only uses gauges in training period
Ocean Comparisons (7-Year Filtered) • RCCA & REOF differ before 1980 • 1970s climate shift in RCCA • REOF does not resolve trend in RCCA & in AR4 ensemble • RCCA & REOF(GPCP) similar
Merged Reconstructions • Over land • REOF • Over oceans • REOF interannual and RCCA multi-decadal • Comparison to AR4 Ensemble • 1st mode, compares model and reconstruction response to climate change Merged reconstruction available at http://cics.umd.edu/~tsmith/recpr/
GPCP-Period Trends • Full GPCP trends (upper) show the most spatial variation • GPCP filtered with monthly-regional REOF smoother • RCCA is similar to GPCP, but with larger spatial scales and stronger local trends • Testing to evaluate differences in trends
Global-Annual EOF Tests: Ocean Comparisons • 20 mode global-annual EOF • GHCN only & GHCN + PSST (pseudo data from regression against SST) • No PSST: Global EOF multi-decadal change similar to RCCA • With PSST: The trend is stronger and spatial scales of the trend are larger
Summary • Regional-monthly REOF resolves oceanic interannual variations, but is less consistent for oceanic multi-decadal variations • Global-annual RCCA using SST & SLP indicates oceanic multi-decadal increasing precipitation, roughly consistent with climate models • Merged analysis combining the regional-monthly REOF and the RCCA has been developed and is available at http://cics.umd.edu/~tsmith/recpr/ • Tests using a global-annual EOF show: • Global multi-decadal variations in RCCA are similar to those from a global-annual EOF reconstruction computed from only gauges • Trends are stronger and spatial scales are larger using SST information • Reconstruction testing and improvements are continuing
Anomaly Distribution • Relative frequency distribution for common months and locations (1992-2001) • Both anomalies approximately normal • reconstruction methods should work
Trend Maps: Global EOF and RCCA • Global EOF using only gauges: • Trend has smaller-scale patterns • Global EOF using gauges and pseudo-observations from SST: • Trend has larger-scale spatial features • RCCA • Large-scale features, roughly similar to those in EOF with pseudo-observations • Many large-scale features similar in all • Use of correlated data (SST or SLP or both) causing trend spatial scales to expand
Global-Annual EOF Tests: Gauge Area • 20 mode global-annual EOF • GHCN only & GHCN + PSST • Gauge average: heavy black dashed line • No PSST: EOF similar to gauge average • With PSST: negative trend before 1950