Download
1 / 69
690 likes | 819 Vues
This presentation explores the necessity of trade policy and the reasons behind government restrictions on trade. While trade can enhance welfare by optimizing production and consumption based on market equilibrium, several factors lead to trade limitations. We analyze the relationship between supply, demand, and world prices, and how economic surplus is affected by exports and imports. The effects of trade are further illustrated using concepts from Chapter 17 of our textbook, aiming to clarify the complexities and advantages of international trade, including the roles of organizations like the WTO and NAFTA.

E N D
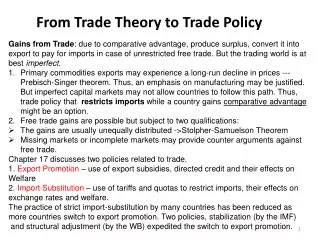
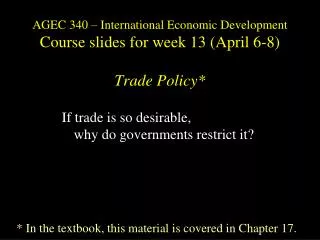
AGEC 340 – International Economic DevelopmentCourse slides for week 13 (April 6-8)Trade Policy* If trade is so desirable, why do governments restrict it? * In the textbook, this material is covered in Chapter 17.
So far…we’ve explained prices and quantities in terms of market equilibrium between supply and demand Price ($/lb) 1.25 S 1.00 0.75 D Quantity (thousands of tons/yr) 10 15 17
…but usually trade is available, so our price is determined by equilibrium with trade For exported goods For imported goods Price ($/lb) Price ($/lb) 1.25 1.25 S S 1.00 1.00 0.75 0.75 D D 10 17 10 17 Exports = 7 Imports = 7
Our production & consumption depend on our S & D curves relative to the given world price... An export An import S S Pt Pt D D Q Q Qd Qs Qs Qd Our exports Our imports
So why worry about trade? Who cares about the WTO or NAFTA? An export An import S S Pt Pt D D Q Q Qd Qs Qs Qd Our exports Our imports
To see the “welfare effects” of trade, let’s start by looking at a market without trade... P ($/bu) S D Q (bu/yr)
What price do we expect to observe? P ($/bu) S D Q (bu/yr)
The equilibrium price is the only price where Qs = Qd P ($/bu) S Pe D Qe Q (bu/yr)
… but it is also the price & quantity which maximizes economic surplus, defined as the area between the supply and demand curves P ($/bu) S=marginal cost of production D=consumers’ willingness to pay Q (bu/yr)
… at low quantities, there’s a big gap, so increasing quantity is very valuable! P ($/bu) S=marginal cost of production D=consumers’ willingness to pay Q (bu/yr) a small quantity
As production & consumption increase, the gain in economic surplus gets smaller... P ($/bu) S=marginal cost of production D=consumers’ willingness to pay Q (bu/yr) an increased quantity
… but stays positive.. P ($/bu) S=marginal cost of production D=consumers’ willingness to pay Q (bu/yr) an increased quantity
… but stays positive.. P ($/bu) S=marginal cost of production D=consumers’ willingness to pay Q (bu/yr) an increased quantity
… but stays positive.. P ($/bu) S=marginal cost of production D=consumers’ willingness to pay Q (bu/yr) an increased quantity
… but stays positive.. P ($/bu) S=marginal cost of production D=consumers’ willingness to pay Q (bu/yr) an increased quantity
…until it hits the equilibrium quantity! P ($/bu) S=marginal cost of production D=consumers’ willingness to pay Qe Q (bu/yr)
At the equilibrium quantity, consumers are willing to pay for one more unit exactly what it costs to produce. P ($/bu) S=producers’ marginal cost Pe D=consumers’ willingness to pay Qe Q (bu/yr)
… so “economic surplus” is maximized. P ($/bu) S=marginal cost of production D=consumers’ willingness to pay Q (bu/yr)
What would happen to economic surplus if production were higher than Qe? P ($/bu) S=marginal cost of production Pe D=consumers’ willingness to pay Qe Q (bu/yr)
Above Qe, marginal costs would be higher than willingness to pay, so economic surplus would fall. P ($/bu) S=marginal cost of production Pe costs exceed benefits D=consumers’ willingness to pay Qe above Qe... Q (bu/yr)
How does trade enter the picture? P ($/bu) S=producers’ marginal cost Pe D=consumers’ willingness to pay Qe Q (bu/yr)
For an export, Pt exceeds Pe... P ($/bu) S=producers’ marginal cost Pt Pe D=consumers’ willingness to pay Qe Q (bu/yr)
So Qs exceeds Qd by the amount of exports... P ($/bu) S=producers’ marginal cost Pt Pe D=consumers’ willingness to pay Qe Qd Qs Q (bu/yr) exports
Who gains from trade? Who loses? P ($/bu) S=producers’ marginal cost Pt the price rises Pe D=consumers’ willingness to pay Qe Qd Qs Q (bu/yr) consumption falls production rises
To value gains and losses, we need to distinguish between consumers’ economic surplus and producers’ economic surplus P ($/bu) S=producers’ marginal cost Pt the price rises Pe D=consumers’ willingness to pay Qe Qd Qs Q (bu/yr) consumption falls production rises
the change from no-trade to exports reduces consumers’ surplus, defined as area between demand curve and price loss in consumers’ surplus due to higher price P ($/bu) S=producers’ marginal cost Pt CS loss: Pe D=consumers’ willingness to pay Qe Qd Qs Q (bu/yr) consumption falls production rises
the change from no-trade to exports increases producers’ surplus, defined as area between supply curve and price gain in producers’ surplus due to higher price P ($/bu) S=producers’ marginal cost Pt PS gain: Pe D=consumers’ willingness to pay Qe Qd Qs Q (bu/yr) consumption falls production rises
Which is bigger?Here, PS gain is always larger than CS loss! This triangle is a net gain in national economic surplus P ($/bu) S=producers’ marginal cost Pt CS loss: PS gain: Pe Net gain: D=consumers’ willingness to pay Qe Qd Qs Q (bu/yr) consumption falls production rises
Magic! Exports offer money for nothing, requiring only that we adjust to the foreigners’ prices… This triangle is a net gain in national economic surplus P ($/bu) S=producers’ marginal cost Pt Pe D=consumers’ willingness to pay Qe Qd Qs Q (bu/yr) consumption falls production rises
OK, so exports create economic gains… what about imports? P ($/bu) S=producers’ marginal cost Pe Pt D=consumers’ willingness to pay Qe Qd Qs Q (bu/yr) consumption falls production rises
the change from no-trade to imports reduces producers’ surplus P ($/bu) S=producers’ marginal cost PS loss: Pe Pt D=consumers’ willingness to pay Qe Qs Qd Q (bu/yr) production falls consumption rises
…but going from no-trade to imports increases consumer surplus P ($/bu) S=producers’ marginal cost PS loss: Pe CS gain: Pt D=consumers’ willingness to pay Qe Qs Qd Q (bu/yr) production falls consumption rises
Again magic! Imports also offer money for nothing, requiring only that we adjust to foreign prices… This triangle is a net gain in national economic surplus P ($/bu) S=producers’ marginal cost PS loss: Pe CS gain: Net gain: Pt D=consumers’ willingness to pay Qe Qs Qd Q (bu/yr) production falls consumption rises
Now, we need to start from free trade, and ask:Who gains and who loses what from an import tariff? Price Gains and losses from the tariff Change in: Producer surplus: +A Consumer surplus: -ABCD Govt. revenue: +C Nat’l. econ. surplus: -BD price in domestic market Pd import tariff t A B C D Pt price in trade, or “world price” Supply Demand Qty. Qs Qs’ Qd’ Qd
How about when government restricts an export?Who gains and who loses what from an export tax? Price price in trade, or “world price” Demand Supply Pt B D export tax C t A Gains and losses from the tax Change in Producer surplus: -ABCD Consumer surplus: +A Gov’t. revenue: +C Nat’l. econ. surplus: -BD Pd price in domestic market Qd Qd’ Qs’ Qs
So is more trade better? What if government subsidizes exports?Who gains and who loses what from an export subsidy? Price Demand price in domestic market Supply Pd C E export subsidy s A D B F Gains and losses from the subsidy Change in Producer surplus: +ABCDE Consumer surplus: -AB Gov’t. revenue: -BCDEF Nat’l. econ. surplus: -BF Pt price in trade, or “world price” Qd Qd’ Qs’ Qs Conclusion: it’s not trade that creates value; it’s free trade
Some preliminary conclusions… • The simple bit of economics so far tells us that… • Exports are not “better” than imports • More trade is not “better” than less trade • What’s best is free trade… • But, from the example of environmental policies in week 8, may need plenty of domestic taxes, subsidies, or regulations to offset externalities in production and consumption.
Now, some more detail • So far we have taken foreign prices as given – just like in the first half of the semester, the household takes market prices as given • But where do foreign prices come from? We need to understand that market too!
Start with our country’s S&D diagram... Our country
...as compared with the rest of the world: Our country The rest of the world
But the quantity scales are different! Our country The rest of the world Q (thou. tons) Q (tons)
If people in the two markets can trade… Our country Int’l. Trade The rest of the world Q (tons) Q (thou. tons) Q (tons)
...our country won’t trade anything at our Pe. Our country Int’l. Trade The rest of the world Pe Q (tons) Q (thou. tons) Q (tons)
…but at higher prices, we’d export the “surplus” (production - consumption) Our country Int’l. Trade The rest of the world Q (tons) Q (thou. tons) Q (tons)
…creating a “supply of exports” curve Our country Int’l. Trade The rest of the world Sexports Q (tons) Q (thou. tons) Q (tons)
…and similarly for the rest of the world... Our country Int’l. Trade The rest of the world Sexports Q (tons) Q (thou. tons) Q (tons)
…except that the scale is different! Our country Int’l. Trade The rest of the world Sexports a small gap here is a large gap here, because of different scales Q (tons) Q (thou. tons) Q (tons)
…so their “demand for imports” curve is very flat Our country Int’l. Trade The rest of the world Sexports Dimports Q (tons) Q (thou. tons) Q (tons)
Let’s clean up the diagram a little... Our country Int’l. Trade The rest of the world Sexports Simports Q (tons) Q (thou. tons) Q (tons)