Download

1 / 38
380 likes | 483 Vues
Explore the current economic landscape worldwide and in South Africa, including growth, inflation, and housing trends. Discover insights on global markets, commodity prices, and rental market dynamics.

E N D
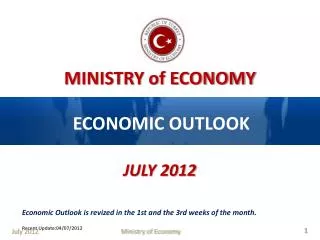
The sceptical optimist: – Mike Schussler Economists.co.za PayProp.Economic Outlook & rental index. www.economists.co.za
The world and SA prospects. • What the world looks like today. • South Africa. • Inflation • Growth and sectors • Something on construction.
The developed world is slowing again after the great recession. www.Economists.co.za
Some IMF growth forecasts www.Economists.co.za
Real Interest rates and Commodity prices. www.Economists.co.za
Monetary Policy in Developed country is going to remain loose for some time Very low interest rates keep the world going at present. They are unlikely to raise any time soon perhaps not even in 2014. www.Economists.co.za
Long bonds show bigger differences between countries. www.Economists.co.za
USA houses built. www.Economists.co.za
World total equity returns www.Economists.co.za
World summary from IMF • Global output expanded by about 4,0% in 2011 and is forecasted to expand by 3,5% in 2012. (Down from 4,5% and 4,9% respectively from April 2011 estimates ) • Advanced economies' growth to slow to 1.5% from 3% per cent last year and estimates of 2% in 2013. • Emerging markets to see average 5.75% growth, down from 6,25% in 2011 recovering to 6% in 2013. • Everything just looks slower than before and risks are firmly on the downside. • Africa is growing 5% plus twice SA rate. www.Economists.co.za
Overview • The effects of crisis are lasting a lot longer. • IMF forecasts are too optimistic and world growth likely to be below 3,5%, Emerging markets to grow fast but less than before. • The world’s debt crisis is still with us and may take more than say five more years to sort out. • Higher prices have a political effect as well as lower prices particularly food and oil.
It’s true we have a R3,3 Trillion Rand economy. South African Economy. Slower growth and higher inflation. economists.co.za
Early indications of a rapid slowdown –at present. www.Economists.co.za
GDP detail and History. www.Economists.co.za
SA Manufacturing. www.Economists.co.za
Mining and manufacturing as % of GDP vs. the commodity boom. Missing the Boat. economists.co.za
Retail sales and rates. www.Economists.co.za
Real Prime rate www.Economists.co.za
SA Forecasts. • Inflation to rise to 6.2% according to Treasury in 2012. • We think 6%. • GDP Growth to slow to 2,7% according to government. • We think 2,4% • Low Interest rates to stay for the whole year. • Fighting a battle against possible recession likely to win but at a higher debt cost. economists.co.za
Something on Houses and rents Gloomy on prices but perhaps rentals will go a little higher. www.Economists.co.za
House prices around the world 1. www.Economists.co.za
House prices around the world 2 www.Economists.co.za
Very important background facts. • SA has just over 14 million households. • We built over 4 million houses since 1994 Just over 3,2 million by the state and over 1 million private. • Just over 10,1 million live in formal brick structures (i.e. houses and flats) • The rest live in traditional or informal settlements. (Some traditional are brick today) • Over 2,9 million households rent of which 1.6 million rent formal structures. www.Economists.co.za
The structure of SA rental market. www.Economists.co.za
Background to formal rental market • Only about 400 000 households paid more than R3 001 in rental every month in 2010. • As Rural and flats (which are cheaper) should also be added and some under reporting takes place some extra rental stock should be added. • We estimate that the Formal rental market was about 675 000 in 2010. • In could now be closer to 700 000. • Payprop currently captures over 50 000 of these properties on rentals and has an extra 8000 plus on its database some of which are not rented out. www.Economists.co.za
Further background from the home owner side. • Over 62% of all South African households own their home (down from last year was close to 70% earlier in the decade). • Over 26% of All households have a second home; many in rural areas which are not rentable. • Nearly 10% of all SA households rely on rent as main income. • About 15% of all households receive rents as part of their income. www.Economists.co.za
SA weighted average monthly rent in Rands per month. www.Economists.co.za
Payprop rental increase on a year ago – smoothed 4 month average. www.Economists.co.za
Payprop rental index. • Rents have barely increased in the last few months as the economy has come under pressure. • The average rent in South Africa was R5178 per month slightly up from the February figure of R5172 per month. • Rents are reacting to the slowdown by not increasing much at this stage. • The smoothed year on year increase is the lowest in more than two years at 4,9%. • This is now below the inflation rate and probably is in response to tough economic conditions. www.Economists.co.za
Average rental per province. www.Economists.co.za
Smoothed rental increases per province. www.Economists.co.za
Number of properties rented out on the Payprop data base. www.Economists.co.za
Some other PayProp interesting facts. • There are now over 50 000 active rented properties on the database and another 15000 inactive or empty properties on the database. • Deposits average around 120% of actual monthly rentals; in the formal rental market. • We estimate that about 6% to 8% of all normal houses are empty at any stage • This is bigger in seasonal resorts where this could be as higher than 25% on average. www.Economists.co.za
What are Gross returns look like in SA rental market • Using nominal rental income of R5178 per month gross returns on a medium house (using ABSA prices @ R968 600) would be 6,42% • Using ABSA small house price – currently 666900 the gross return is 9.32% • Using an average between medium and small houses the gross rental returns is 7,6% www.Economists.co.za
Net returns • Using the average of ABSA medium and small houses. • Using average municipal charges estimated at around 6700 per year for the landlord. • Assuming about 7% time of the time not rented. • The average return drops to just under 6,3% at present. • This is at least a little higher than money in the bank and should improve over time. www.Economists.co.za
Questions. Thank you. www.Economists.co.za
SA construction % changes www.Economists.co.za
SA construction boom is over! www.Economists.co.za