Ag. Outlook
Ag. Outlook. Chad Hart Center for Agricultural and Rural Development Iowa State University E-mail: chart@iastate.edu Northwest Iowa Agronomy Group Holstein, Iowa March 25, 2008. Recession?. Typically defined as two or more quarters of negative economic growth

Ag. Outlook
E N D
Presentation Transcript
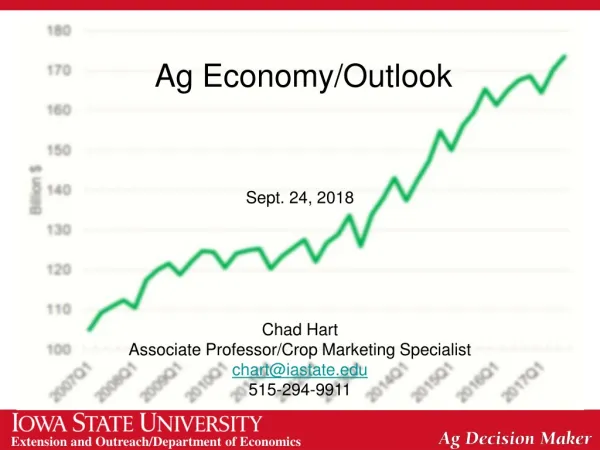
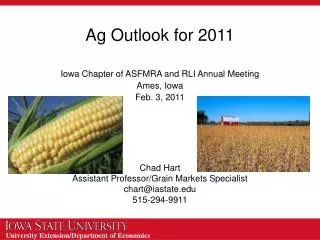
Ag. Outlook Chad Hart Center for Agricultural and Rural Development Iowa State University E-mail: chart@iastate.edu Northwest Iowa Agronomy Group Holstein, Iowa March 25, 2008
Recession? Typically defined as two or more quarters of negative economic growth Looser definition: significant decline in economic activity over a few months Can be accompanied by deflation or inflation - stagflation is the combination of inflation and recession Takes several months to confirm if you’re in one “Economists have correctly predicted nine of the last five recessions.” -- Paul Samuelson
Recession? Ongoing debate whether we’re in one or not (slowdown vs. recession) Housing market and subprime mortgage crisis are significant contributors Projections range from slowdown to significant recession Bloomberg News surveyed several economists on economic outlook – Predicted GDP growth for 1st quarter 2008 = 0.1% Federal Reserve continues to lower interest rates, but is monitoring inflation
Corn Market Factors • Domestic demand changes • Biofuels • Livestock feed • South American planting and production • Export competition • Competition for acreage • Corn vs. soybeans vs. wheat • Tighter stocks • More sensitivity to weather shocks
U.S. Corn Supply and Demand Source: USDA
World Corn Production Source: USDA
Corn Production Costs - National Source: USDA-ERS
Soybean Market Factors • Domestic demand changes • Biofuels • Livestock feed • South American planting and production • Export competition • Competition for acreage • Corn vs. soybeans vs. wheat • Tighter stocks • More sensitivity to weather shocks
U.S. Soybean Supply and Demand Source: USDA
World Soybean Production Source: USDA
Soybean Production Costs - National Source: USDA-ERS
Price Summary Source: USDA
U.S. Export Summary Source: USDA
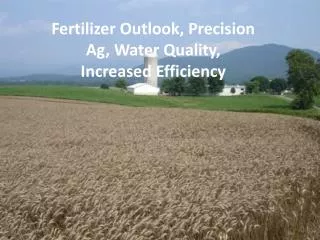
Biofuel Factors • Feedstock costs and competition • High corn prices • High soybean oil prices • Vegetable oil demand in Southeast Asia • Energy markets • High oil and gas prices • Continued government support • Passage of the 2007 Energy Act • Efforts to extend biofuel tax credits • Consumer demand for biofuels • Southeast U.S.
Ethanol Expansion Source: Renewable Fuels Association
U.S. Ethanol Industry • Current ethanol capacity: 141 plants, 8 billion gallons/year • Total capacity under construction and expansion: 5.4 billion gallons/year • 59 new ethanol plants and 7 expansion projects underway • 2.1 billion bushels of corn were used in producing fuel ethanol in 2006/2007 marketing year. • 3.2-3.5 billion bushels of corn are expected to be used in producing fuel ethanol for 2007/2008 marketing year.
Biodiesel Growth Source: National Biodiesel Board