Download
1 / 34
340 likes | 367 Vues
Ag Outlook. Nov. 2, 2017 Chad Hart Associate Professor/Crop Marketing Specialist chart@iastate.edu 515-294-9911. U.S. Corn Supply and Use. Source: USDA-WAOB. U.S. Soybean Supply and Use. Source: USDA-WAOB. Projected Corn Yields. Top: 2017 Yield Estimate Bottom: Change from last month

E N D
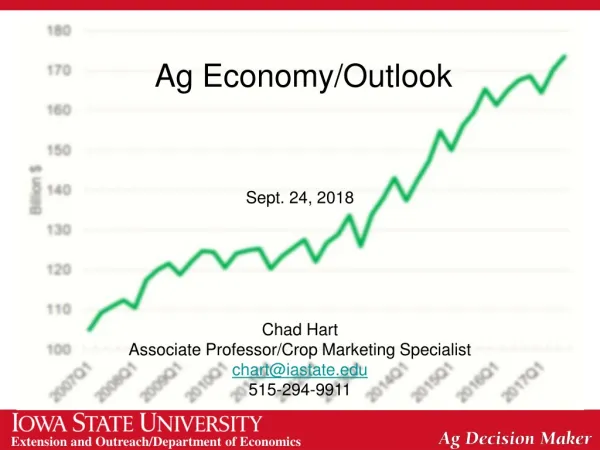
Ag Outlook Nov. 2, 2017 Chad Hart Associate Professor/Crop Marketing Specialist chart@iastate.edu 515-294-9911
U.S. Corn Supply and Use Source: USDA-WAOB
U.S. Soybean Supply and Use Source: USDA-WAOB
Projected Corn Yields Top: 2017 Yield Estimate Bottom: Change from last month Units: Bushels/acre Source: USDA-NASS
Projected Soybean Yields Top: 2017 Yield Estimate Bottom: Change from last month Units: Bushels/acre Source: USDA-NASS
World Corn Production Source: USDA-WAOB
World Soybean Production Source: USDA-WAOB
U.S. Meat Production & Prices Source: USDA-WAOB
U.S. Meat Trade Million pounds Source: USDA-WAOB
Key factors for 2017 and beyond • Crops/Feedstuffs – BULLISH for livestock sector. • Supply – Growing and competing animal protein supplies. • Domestic Demand – Increasingly competitive environment, battle for market share. • Trade – Stabilizing factor. Strong exports and declining imports. • Producers resiliently charging ahead.
+8.1% (‘15 vs ‘14) +2.4% (‘16 vs ‘15) +3.2% (’17YTD vs ’16YTD) Source: USDA/AMS. * Steve Meyer, EMI.
Source: Steve Meyer. Published in National Hog Farmer Magazine, July 27, 2017.
Pork Export Shifts Source: USDA-FAS
LMIC Pork Production Quarterly Forecasts (10/2/17) Sources: USDA/NASS; USDA/AMS Livestock Market News; Projections and Forecasts by LMIC
Data Source: USDA-NASS, Forecasts by LMIC Livestock Marketing Information Center
Data Source: USDA-AMS, Compiled and Forecasts by LMIC Livestock Marketing Information Center
Beef Export Shifts Source: USDA-FAS
Data Source: USDA & LMIC, Compiled by LMIC Livestock Marketing Information Center
Corn Export Sales Source: USDA-FAS
Corn Export Shifts Source: USDA-FAS
Soybean Export Sales Source: USDA-FAS
Soybean Export Shifts Source: USDA-FAS
Ethanol Production Sources: EIA, my projection for 2017
Ethanol Exports Source: EIA
Current Corn Futures 3.94 3.55 Source: CME Group, 11/1/2017
Current Soybean Futures 9.88 9.75 Source: CME Group, 11/1/2017
Thank you for your time!Any questions?My web site:http://www2.econ.iastate.edu/faculty/hart/Iowa Farm Outlook:http://www2.econ.iastate.edu/ifo/Ag Decision Maker:http://www.extension.iastate.edu/agdm/