Download
1 / 68
680 likes | 713 Vues
Explore the current statistics, treatment approaches, and challenges faced by PLHIV in Asia and the Pacific region. Learn about the journey of AIDS by the numbers and the urgent need for a focused response. Discover the progress towards the 90-90-90 targets and the availability of HIV testing services.

E N D
People living with HIV (PLHIV) Last updated: February 2019
CONTENT Overview Treatment - Treatment: Antiretroviral therapy - Treatment: PMTCT - Treatment: TB-HIV Co-treatment Women living with HIV and reproductive health rights Punitive laws hindering the HIV response among PLHIV
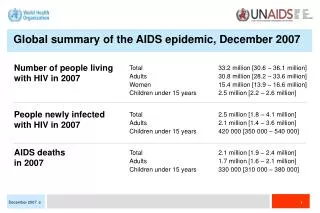
Journey of AIDS by the numbers Since the beginning of the epidemic - Globally… In Asia and the Pacific… 77millionpeople have become infected with HIV 12millionpeople have become infected with HIV population size of Turkey Almost twice the population size of Lao PDR 35millionpeople have died from AIDS-related illnesses 6millionpeople have died from AIDS-related illnesses population size of Canada population size of Singapore Source: Prepared by www.aidsdatahub.org based on UNAIDS 2018 HIV Estimates
People living with HIV 5.2 million Women living with HIV 1.9 million New HIV infections 280,000 Regional snapshot of HIV infections and AIDS-related deaths HIV and AIDS in Asia and the Pacific, 2017 Young people living with HIV 450,000 Children living with HIV 110,000 Deaths 170,000 Source: Prepared by www.aidsdatahub.org based on UNAIDS 2018 HIV Estimates
Global 18% decline between 2010 and 2017 Despite earlier achievements, the decline in new HIV infections has stalled during the past 7 years 1 800 000 new HIV infections in 2017 Fast-Track Target 2020: 500 000 new HIV infections New HIV infections Asia and the Pacific 14% decline between 2010 and 2017 New HIV infections Fast-Track Target 2020: 90 000 new HIV infections 280 000 new HIV infections in 2017 New HIV infections 2020 Fast-Track target* *The 2020 target is equivalent to a 75% reduction since 2010. Source: Prepared by www.aidsdatahub.org based on UNAIDS 2018 HIV Estimates
HIV is not over yet! Miles to go and gaps to address Percent change in new HIV infections between 2010 and 2017 HIV testing and treatment cascade, 2017 0.8 million 1.5million 1.4 million 2.7 million 2.3 million 3.8 million Malaysia Indonesia Philippines Viet Nam India Myanmar Pakistan Thailand Source: Prepared by www.aidsdatahub.org based on UNAIDS 2018 HIV Estimates
People who inject drugs Transgender Men who have sex with men Rest of population Sex workers Clients of sex workers and partners of key populations Urgent need for focused response: location-population approach! Distribution of new HIV infections by country in Asia and the Pacific Share of new HIV infections by population in Asia and the Pacific 84% of new HIV infections among key populations and their partners 9 countries account for 96% of total 280 000 new HIV infections in Asia Pacific Source: Prepared by www.aidsdatahub.org based on UNAIDS 2018 HIV Estimates and AIDS Epidemic Modelling submitted for GAM reporting
HIV testing is the entry point for prevention and treatment but about half of key populations do not know their HIV status HIV testing coverage among key populations, 2014 - 2017 Source: Prepared by www.aidsdatahub.org based on Global AIDS Monitoring (GAM) Reporting 2017 and 2018
HIV testing is the entry point for prevention and treatment, but many key populations do not know their HIV status Female sex workers Male sex workers Men who have sex with men Transgender people People who inject drugs 90% 90% 90% 90% 90% Prepared by www.aidsdatahub.org based on Global AIDS Monitoring 2018; Integrated Bio-Behavioural Surveys; and Behavioural Surveillance Surveys
Availability of community-based and lay provider testing approaches in Asia and the Pacific,2018 Both community-based and lay provider HIV testing available Community-based HIV testing available Lay provider HIV testing available Not available No info Source: www.aidsdatahub.org based on Global AIDS Monitoring (GAM) 2018
Independent access to HIV testing and related services for young people in Asia and the Pacific Age of legal capacity to consent independently to an HIV test, Asia and the Pacific Source: UNICEF, UNESCO, UNFPA, UNODC, Youth LEAD, & Youth Voices Count. (2015). Adolescents Under the Radar in the Asia-Pacific AIDS Response.
Fast-Track Target 2020: 4.2 million people on ART Fast-Track Treatment to Reach 90–90–90 by 2020 At current pace: 3.4 million people on ART by 2020 People receiving ART in Asia and the Pacific 2017 estimate: 2.7 million 14% annual increase between 2013 and 2017 Source: Prepared by www.aidsdatahub.org based on UNAIDS 2018 HIV Estimates; Global AIDS Monitoring (GAM) 2018
79% [59 – >95%] 81% [60 – >95%] 75% [55 – 92%] Progress towards the 90–90–90 targets: Global versus Asia and the Pacific, 2017 Global Asia and the Pacific 85% [60 – >95%] 74% [52 – >95%] 71% [50 – >95%] of people living with HIV who know their status are on treatment of people living with HIV know their status of people on treatment are virally suppressed Source: Prepared by www.aidsdatahub.org based on UNAIDS special analysis, 2018
Asia and the Pacific Towards 90-90-90 Fast-Track treatment targets Treatment cascade, 2017 74% 5.2 M 85% 71% PLHIV know their status Tested for viral load* Estimated PLHIV People on ART Suppressed viral load 0 25 Countries with CD4 threshold policy for treatment initiation countries have national policy on routine viral load monitoring for antiretroviral therapy 2016 2018 * China and India do not report viral load testing data in 2018 GAM reporting. Estimated 55% of PLHIV who are on treatment in 13 reported countries had tested for viral load in the past 12 months. treat all regardless of CD4 15 30 CD4 ≤ 500 but treat all key populations regardless of CD4 6 0 CD4 ≤ 500 9 2 CD4 ≤ 350 but treat all key populations regardless of CD4 2 0 Prepared by www.aidsdatahub.org based on Global AIDS Monitoring 2018 Reporting and UNAIDS 2018 HIV Estimates
Regional overview: 90-90-90 target and gaps HIV testing and treatment cascade, Asia and the Pacific, 2017 0.8million 1.5million 1.4 million 2.7million 3.8million 2.3million ACHIEVED ACHIEVED ACHIEVED Singapore; Thailand Cambodia Cambodia NOT ON-TRACK (<50%) NOT ON-TRACK (<30%) NOT ON-TRACK (<30%) Bangladesh; Indonesia; Mongolia; Pakistan Pakistan Bangladesh; Indonesia; Mongolia; Pakistan Prepared by www.aidsdatahub.org based on UNAIDS special analysis 2018; UNAIDS 2018 estimates and Global AIDS Monitoring 2018 DATA NOT AVAILABLE DATA NOT AVAILABLE DATA NOT AVAILABLE Afghanistan; China; Japan; New Zealand; PNG Afghanistan; Australia; Bangladesh; China; Indonesia; Japan; Mongolia; Myanmar; New Zealand; PNG; Philippines Afghanistan; Australia; China; Japan; Myanmar; New Zealand; PNG; Viet Nam
Current treatment scale-up has made significant achievement but the region is lagging behind the global trend ART coverage and treatment gap, Asia and the Pacific, 2017 ART coverage (%) Treatment gap Prepared by www.aidsdatahub.org based on Global AIDS Monitoring 2018 Reporting and UNAIDS 2018 HIV Estimates
Variation in achievement of 2nd 90 treatment (81% of ART coverage) among children living with HIV, 2017 Percentage of children living with HIV receiving ART, 2017 2nd 90 target Prepared by www.aidsdatahub.org based on UNAIDS 2018 estimates and Global AIDS Monitoring 2018
Low level of access to treatment among key populations ART coverage: Female sex workers living with HIV vs. women (15+) living with HIV, 2017 81% Prepared by www.aidsdatahub.org based on Global AIDS Monitoring 2018
Low level of access to treatment among key populations ART coverage: Male key populations living with HIV vs. men (15+) living with HIV, 2017 81% Prepared by www.aidsdatahub.org based on Global AIDS Monitoring 2018
Late diagnosis: up to 50% of PLHIV have the initial CD4 count of <200 cells/mm³ in 2017 Prepared by www.aidsdatahub.org based on Global AIDS Monitoring Reporting 2018
HIV self-testing policy landscape, 2016 As of October 2016, 4 countries in Asia and the Pacific report having policies supportive of HIV self-testing * * HIV self-testing in Thailand is under consideration Source: WHO.(2016). Overview of the New Guidelines on HIV Self-Testing and Partner Notification: What You Need to Know
Generic competition lowers live-saving ART prices Evolution in price of different first-line regimens X 10 times lower Prepared by www.aidsdatahub.org based on Medecins Sans Frontieres (MSF) (2016). Untangling the Web of Antiretroviral Price Reductions -18th Edition
Generic ARVs and impact on government budget: Thailand example Source: Presentation by ChutimaAkaleephan presented at the Regional Experts Consultation on Access to Affordable Medicines, Diagnostics and Vaccines in Bangkok, March 2016 based on NHSO Thailand data
X17.4 X6.5 Newer, more effective, less toxic medicines often unaffordable for the poor and developing countries X2.7 US$ per person per year Second-line regimen First-line regimen Third-line regimen Prepared by www.aidsdatahub.org based on Medecins Sans Frontieres (MSF) (2016). Untangling the Web of Antiretroviral Price Reductions -18th Edition
High out of pocket health payment in countries with highest HIV burden Out-of-pocket payment as % of total health expenditure Prepared by www.aidsdatahub.org based on http://www.who.int/gho/database/en/
Estimated new HIV infections among children (0-14 years) in Asia and the Pacific: current trend and trend to Fast-Track target Estimate 2017: 10 000 2020 estimate based on current trend: 8 000 new HIV infections Falls short of target by: 6 000 Fast-Track Target 2020: 1900 new HIV infections Source: Prepared by www.aidsdatahub.org based on UNAIDS 2018 HIV Estimates
Efforts are needed to eliminate new HIV infections among children (0-14 years) in Asia and the Pacific Prevention of mother-to-child transmission (PMTCT) coverage, Global and Asia and the Pacific, 2010-2017 Prepared by www.aidsdatahub.org based on Global AIDS Monitoring 2018 Reporting and UNAIDS 2018 HIV Estimates
45% early infant diagnosis 56% received ARVs for PMTCT Towards ending AIDS in children starts with mothers: time to improve linkages and prevent leakages Service cascade of prevention of mother-to-child transmission of HIV in Asia and the Pacific, 2017 Note: Coverage of infant ARV prophylaxis is not captured in GAM 2018 reporting Prepared by www.aidsdatahub.org based on Global AIDS Monitoring 2018 Reporting and UNAIDS 2018 HIV Estimates
Regional overview: Prevention of mother-to-child transmission Pregnant women living with HIV who received ARVs to reduce the risk of mother-to-child transmission of HIV, 2017 PMTCT coverage (%) Prepared by www.aidsdatahub.org based on UNAIDS 2018 estimates and Global AIDS Monitoring 2018
2020 target Received PMTCT (2017) GAP 2020 target Children new infections (2017) GAP Regional child new HIV infections gap, 2017 Regional PMTCT gap, 2017 34000 24000 8000 0 95% 10000 1900 Proportion of regional child new infections gap by country Proportion of regional PMTCT gap by country Prepared by www.aidsdatahub.org based on UNAIDS 2018 estimates and Global AIDS Monitoring 2018
Globally… TB snapshot 2017 10.0millionnew TB infections of which 0.6 millionareMDR/RR-TB infections 1.6 millionTB deaths 6.84millionnew TB infections (+2/3) In Asia and the Pacific… 0.34 millionareMDR/RR-TB infections (2/3) 0.83 millionTB deaths (1/2) MDR/RR-TB = Rifampicin Resistant (RR) -TB cases including MDR-TB cases Source: Prepared by www.aidsdatahub.org based on WHO. (2018). Global TB Report 2018
TB snapshot 2017 Asia and the Pacific is the home for… 6.8 M More than 2/3 of estimated new TB cases globally 199 K More than 1/5 of estimated TB-HIV co-infections globally 830 K More than 1/2 of estimated TB mortality globally (both HIV-negative and HIV-positive) Source: Prepared by www.aidsdatahub.org based on WHO. (2018). Global TB Report 2018
Over a third of high TB burden countries are in Asia and the Pacific 30 high-burden countries (Tuberculosis) Asia and the Pacific Source: Prepared by www.aidsdatahub.org based on WHO. (2018). Global TB Report 2018
Estimated burden of HIV and TB in select countries, 2017 Source: Prepared by www.aidsdatahub.org based on WHO. (2018). Global TB Report 2018 and UNAIDS Estimates 2018
Estimated HIV prevalence in incident TB cases, 2017 Source: Prepared by www.aidsdatahub.org based on WHO. (2018). Global TB Report 2018
Need to scale-up HIV testing among TB patients in Asia Proportion of TB patients with known HIV status, 2017 Source: Prepared by www.aidsdatahub.org based on WHO. (2018). Global TB Report 2018
Need to scale-up HIV testing among TB patients in the Pacific Proportion of TB patients with known HIV status, 2017 Source: Prepared by www.aidsdatahub.org based on WHO. (2018). Global TB Report 2018
Considerable proportion of TB patients do not know their HIV status – TB case finding gaps and HIV testing gap Proportion of TB patients with known HIV status by TB notification status in TB programmes, 2017 Notified TB patients know their HIV status TB cases notified but not tested for HIV (HIV testing gap) Undiagnosed TB cases (TB case finding gap) Source: Prepared by www.aidsdatahub.org based on WHO. (2018). Global TB Report 2018
TB case detection and HIV screening HIV diagnosis and treatment 6.8 M 191 K 4.5 M Lost opportunities to save lives by putting more people on TB and HIV treatment, Asia and the Pacific, 2017 74 K 2.2 M 49 K TB detection, HIV diagnosis and care cascade in Asia and the Pacific, 2017 Source: Prepared by www.aidsdatahub.org based on WHO. (2018). Global TB Report 2018
Integrated approaches need to strengthen in diagnosis, treatment, and care of TB-HIV co-infections in Asia and the Pacific Continuum of HIV testing, diagnosis, and access to ART among patients enrolled in TB programmes, 2017 49% of diagnosed TB patients tested for HIV 3% HIV positivity rate 66% of diagnosed PLHIV on ART Source: Prepared by www.aidsdatahub.org based on WHO. (2018). Global TB Report 2018
Diagnosis and treatment continuum among HIV-positive TB patients in Asia and the Pacific, 2017 61%of estimated new TB cases who are co-infected with HIV did not know their HIV status Programmatic gap 100% 34%ofidentified HIV-positive TB patients were NOT on ART 39% 66% Source: Prepared by www.aidsdatahub.org based on WHO. (2018). Global TB Report 2018
About 74% of people with TB-HIV co-infection did not have access to antiretroviral therapy in Asia and the Pacific, 2017 Access to antiretroviral therapy among PLHIV vs. people with TB-HIV co-infection, 2017 Denominator: Estimated total PLHIV Denominator: Estimated new TB cases who are HIV- positive Source: Prepared by www.aidsdatahub.org based on WHO. (2018). Global TB Report 2018
Low coverage of TB preventive treatment among PLHIV newly enrolled in HIV care in Asia and the Pacific, 2017 Proportion of PLHIV newly enrolled in HIV care who were started on TB preventive treatment in 2017, countries where data is available Source: Prepared by www.aidsdatahub.org based on WHO. (2018). Global TB Report 2018
TB co-infection: preventable death among PLHIV Estimated number of AIDS-related deaths and TB deaths among PLHIV in 2017, Asia and the Pacific versus global Proportion of TB deaths among PLHIV AIDS-related deaths 940 K About 1 in 5 AIDS deaths are among people with TB-HIV co-infection 21% Asia and the Pacific 170 K About 1 in 3 AIDS deaths are among people with TB-HIV co-infection 32% Global Source: Prepared by www.aidsdatahub.org based on WHO. (2018). Global TB Report 2018
8 countries account for 94% of all TB-related deaths among PLHIV in Asia and the Pacific, 2017 Source: Prepared by www.aidsdatahub.org based on WHO. (2018). Global TB Report 2018