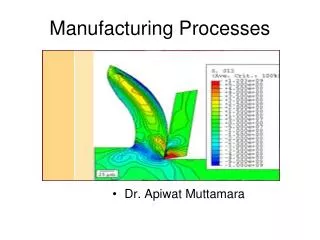
Manufacturing Processes
Manufacturing Processes. Mechanical Properties. Mechanical Properties in Design and Manufacturing. Mechanical properties determine a material’s behavior when subjected to mechanical stresses Properties include elastic modulus, ductility, hardness, and various measures of strength

Manufacturing Processes
E N D
Presentation Transcript
Manufacturing Processes Mechanical Properties
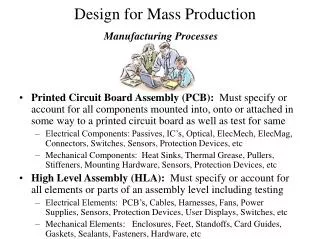
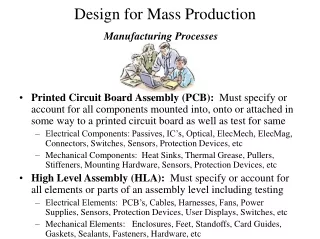
Mechanical Properties in Design and Manufacturing • Mechanical properties determine a material’s behavior when subjected to mechanical stresses • Properties include elastic modulus, ductility, hardness, and various measures of strength • Dilemma: mechanical properties desirable to the designer, such as high strength, usually make manufacturing more difficult • The manufacturing engineer should appreciate the design viewpoint and the designer should be aware of the manufacturing viewpoint
Importance • Influence function and performance • Reflects the capacity to resist deformation
Stress • Tensile • Stretch the material • Compressive • Squeeze the material • Shear • Slide of adjacent portions of the material
C C 3 m 3 m B B B A A 4 m 4 m 30 kN Conceptual Model FBC 5 m 30 kN 3 m = = F’BC 4 m FAB F’AB 30 kN FAB= 40 kN FBC= 50 kN
FBC A Conceptual Model (cont.) • Stress- internal force per unit area FBC C FBC D D B F’BC F’BC
Strain • Strain – elongation per unit of length FBC (e) e C - L L = lo lo lo B F’BC
Measurement Units • International System (SI) • Axial force (F) in Newtons (N) • Area (A) in squared meters (m2) • Stress () in N/m2 or Pascals (Pa) • 1 N/m2 = 1 Pa • US Customary System (USCS) • Axial force (F) in pounds-force (lbf) • Area (A) in squared inches (in.2) • Stress () in lbf/in.2 or psi • internal force per unit area
Tensile Test • Most common test for studying stress‑strain relationship, especially metals • In the test, a force pulls the material, elongating it and reducing its diameter Figure 3.1 ‑ Tensile test: (a) tensile force applied in (1) and (2) resulting elongation of material
ASTM (American Society for Testing and Materials) specifies preparation of test specimen Figure 3.1 ‑ Tensile test: (b) typical test specimen
Figure 3.2 ‑ Typical progress of a tensile test: (1) beginning of test, no load; (2) uniform elongation and reduction of cross‑sectional area; (3) continued elongation, maximum load reached; (4) necking begins, load begins to decrease; and (5) fracture. If pieces are put back together as in (6), final length can be measured
Stress-Strain Relationship Stress‑strain curve - basic relationship that describes mechanical properties for all three types.
Figure 3.3 ‑ Typical engineering stress‑strain plot in a tensile test of a metal after yielding of the material prior to yielding of the material
Elastic Region in Stress‑Strain Curve • Relationship between stress and strain is linear • Material returns to its original length when stress is removed • Hooke's Law: = E e • where E = modulus of elasticity; slope of the curve • E is a measure of the inherent stiffness of a material • Its value differs for different materials
Yield Point in Stress‑Strain Curve • As stress increases, a point in the linear relationship is finally reached when the material begins to yield • Yield point Y can be identified by the change in slope at the upper end of the linear region • Y = a strength property • Other names for yield point = yield strength, yield stress, and elastic limit
Figure 3.3 ‑ Typical engineering stress‑strain plot in a tensile test of a metal after yielding of the material prior to yielding of the material
Plastic Region in Stress‑Strain Curve • Yield point marks the beginning of plastic deformation • The stress-strain relationship is no longer guided by Hooke's Law • As load is increased beyond Y, elongation proceeds at a much faster rate than before, causing the slope of the curve to change dramatically
Stress • Engineering stress
Tensile Strength in Stress‑Strain Curve • Elongation is accompanied by a uniform reduction in cross‑sectional area, consistent with maintaining constant volume • Finally, the applied load F reaches a maximum value, and engineering stress at this point is called the tensilestrengthTS or ultimate tensile strength TS =
UTS Figure 3.3 ‑ Typical engineering stress‑strain plot in a tensile test of a metal YS after yielding of the material prior to yielding of the material
Ductility in Tensile Test Ability of a material to plastically strain without fracture where EL = elongation; Lf = specimen length at fracture; and Lo = original specimen length Lf is measured as the distance between gage marks after two pieces of specimen are put back together
UTS Ductility Figure 3.3 ‑ Typical engineering stress‑strain plot in a tensile test of a metal YS after yielding of the material prior to yielding of the material
True Stress Stress value obtained by dividing the instantaneous area into applied load where = true stress; F = force; and A = actual (instantaneous) area resisting the load
True Strain Provides a more realistic assessment of "instantaneous" elongation per unit length
If previous engineering stress‑strain curve were plotted using true stress and strain values Figure 3.4 ‑ True stress‑strain curve for the previous engineering stress‑strain plot in Figure 3.3
Strain Hardening in Stress-Strain Curve • Note that true stress increases continuously in the plastic region until necking • In the engineering stress‑strain curve, the significance of this was lost because stress was based on an incorrect area value • What it means is that the metal is becoming stronger as strain increases • This is the property called strain hardening
When the plastic region of the true stress‑strain curve is plotted on a log‑log scale, it becomes linear Figure 3.5 ‑ True stress‑strain curve plotted on log‑log scale
Flow Curve Because it is a straight line in a log-log plot, the relationship between true stress and true strain in the plastic region is where K = strength coefficient; and n = strain hardening exponent
Types of stress-strain • Perfectly elastic • behavior follows Hooke’s law; fractures rather than yielding to plastic flow • Elastic and perfectly elastic • Behave as indicated by E; once yield is reached deforms plastically at same stress level. • Elastic and strain hardening • Obeys Hooke’s Law in the elastic region; begin to flow at yield strength (Y); continued deformation requires ever-increasing stress
Perfectly Elastic Behavior is defined completely by modulus of elasticity E • It fractures rather than yielding to plastic flow • Brittle materials: ceramics, many cast irons, and thermosetting polymers Figure 3.6 ‑ Three categories of stress‑strain relationship: (a) perfectly elastic
Elastic and Perfectly Plastic • Stiffness defined by E • Once Y reached, deforms plastically at same stress level • Flow curve: K = Y,n = 0 • Metals behave like this when heated to sufficiently high temperatures (above recrystallization) Figure 3.6 ‑ Three categories of stress‑strain relationship: (b) elastic and perfectly plastic
Elastic and Strain Hardening • Hooke's Law in elastic region, yields at Y • Flow curve: K > Y, n > 0 • Most ductile metals behave this way when cold worked Figure 3.6 ‑ Three categories of stress‑strain relationship: (c) elastic and strain hardening