Download
1 / 37
370 likes | 455 Vues
Study on cosmic ray positrons using Earth’s magnetic field with Fermi LAT, including motivation, methodology, results, and uncertainties analysis.

E N D
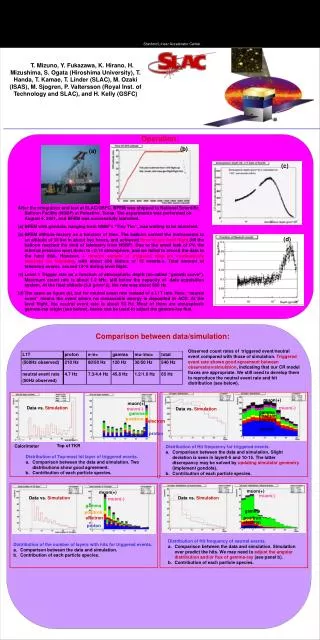
Measurement of the cosmic ray positron spectrum with the Fermi LAT using the Earth’s magnetic field Justin Vandenbroucke (KIPAC, Stanford / SLAC) for the Fermi LAT collaboration International Cosmic Ray Conference, Beijing August 15, 2011
Outline • Motivation • The Fermi Large Area Telescope • Charge identification with the geomagnetic field • Background subtraction • Results Justin Vandenbroucke: Fermi LAT positron spectrum
Motivation: PAMELA measurement of increasing positron fraction, 10-100 GeV Nature 458, 607 (2009) GALPROP diffuse secondary production model (Moskalenko & Strong 1998) Possible explanations: primary astrophysical sources, dark matter, nonstandard secondary production, … Justin Vandenbroucke: Fermi LAT positron spectrum
Fermi LAT measurement of combined cosmic ray electron + positron spectrum from 7 GeV to 1 TeV see A. Moiseev talk Abdo et al., PRL 102, 181101 (2009) Ackermann et al., PRD 82, 092004 (2010) Next: can we identify positrons to check the PAMELA rising fraction? 2 challenges: Suppress p+ flux which is 3-4 order of magnitude larger than e+: same cuts as e+e- analysis and estimate residual background Distinguish e+ from e-: geomagnetic field Justin Vandenbroucke: Fermi LAT positron spectrum
γ e- e+ The Fermi Large Area Telescope (LAT): a pair-conversion telescope with ~1 m2 effective area • Anti-Coincidence Detector: charged particle veto surrounding Tracker, 89 plastic scintillator tiles + 8 ribbons, 0.9997 efficiency for tagging singly charged particles • Tracker: 16 modules: tungsten conversion foils + 80 m2 of silicon strip detectors in 36 layers, 1.5 radiation lengths on-axis • Calorimeter: 16 modules: 96 Cesium Iodide crystals per module, 8.6 radiation lengths on-axis, segmented for 3D energy deposition distribution ~1.8 m Tracker ACD Calorimeter Atwood et al., ApJ 697, 1071 (2009) Justin Vandenbroucke: Fermi LAT positron spectrum
Geomagnetic field + Earth shadow = directions from which only electrons or only positrons are allowed events arriving from West: e+ allowed, e- blocked events arriving from East: e- allowed, e+ blocked • For some directions, e- or e+ forbidden • Pure e+ region looking West and pure e- region looking East • Regions vary with particle energy and spacecraft position • To determine regions, use code by Don Smart and Peggy Shea (numerically traces trajectory in geomagnetic field) • Using International Geomagnetic Reference Field for the 2010 epoch Justin Vandenbroucke: Fermi LAT positron spectrum
Time-dependent region selection • “Deflected horizon” = boundary between allowed and shadowed trajectories • Use instantaneous spacecraft position to determine two horizons for each energy • Three regions: positron-only, electron-only, both-allowed e- deflected horizon (e- forbidden inside) e+ deflected horizon (e+ forbidden inside) e+ only region e- only region both-allowed region Justin Vandenbroucke: Fermi LAT positron spectrum
Validation of magnetic field model + tracer code • Geographical distribution of geomagnetic cutoffs predicted from code matches LAT data (arXiv:1108.0201) • Atmospheric positrons (and electrons) detected precisely from deflected direction expected from code: Justin Vandenbroucke: Fermi LAT positron spectrum
Exposure maps: 2 example energy bins for all 3 regions 32-40 GeV e+e- 32-40 GeV e+ 32-40 GeV e- 63-80 GeV e+e- 63-80 GeV e+ 63-80 GeV e- Exposure units: m2 s Justin Vandenbroucke: Fermi LAT positron spectrum
Two background subtraction methods:(1) Monte Carlo (2) fit transverse shower size in flight data One example energy bin Fit with sum of two Gaussians Wide hadronic + narrow electromagnetic showers e- region e+ + e-region e+ region Justin Vandenbroucke: Fermi LAT positron spectrum
Two background subtraction methods produce consistent results MC-based background subtraction Fit-based background subtraction Three cross checks: • Two background subtraction methods consistent • Summed flux from e- and e+ regions matches flux from both-allowed region • Flux from both-allowed region matches previously published e+e- total flux Justin Vandenbroucke: Fermi LAT positron spectrum
Systematic uncertainties in spectra Uncertainty of positron fraction is smaller (Aeff uncertainty cancels) Justin Vandenbroucke: Fermi LAT positron spectrum
Final results: electron-only, positron-only, and both-allowed spectra Use fit-based result (lower uncertainty than MC-based) except for highest energy bin, where statistics insufficient for fitting Justin Vandenbroucke: Fermi LAT positron spectrum
Final results: positron fraction • Fraction = ϕ(e+) / [ϕ(e+) + ϕ(e-)] • We don’t use the both-allowed region except as a cross check • Positron fraction increases with energy from 20 to 200 GeV Justin Vandenbroucke: Fermi LAT positron spectrum
extra slides Justin Vandenbroucke: Fermi LAT positron spectrum
Angular distribution of events above 100 GeV(with respect to deflected positron horizon, for events below deflected electron horizon) Justin Vandenbroucke: Fermi LAT positron spectrum
The Fermi Gamma-ray Space Telescope • Launched by NASA at Cape Canaveral June 11, 2008 • Routine science began August 2008 • Two instruments • Large Area Telescope: 20 MeV – 300 GeV • Gamma-ray Burst Monitor: 8 keV – 40 MeV • Data publicly available since August 2009 • Orbit: 565 km, 25.6o inclination, circular • Field of view = 2.4 sr (38% of 2π) • Observe entire sky every 2 orbits = 3 hrs • Expect thousands of sources, with spectra for hundreds • ~0.1° resolution at 10 GeV, ~0.5° at 1 GeV, ~4° at 100 MeV Justin Vandenbroucke: Fermi LAT positron spectrum
ATIC (Advanced Thin Ionization Calorimeter): bump in combined electron + positron spectrum at 300-800 GeV • 3 balloon flights in Antarctica, 2000-2008 • 70 events between 300 and 800 GeV Nature 456:362, 2008 ATIC AMS-01 BETS, PPB-BETS PPB-BETS x PPB-BETS - GALPROP --- GALPROP with solar modulation Justin Vandenbroucke: Fermi LAT positron spectrum
Recently updated PAMELA electron + positron analysis PRL 106, 201101 (May 20, 2011) Justin Vandenbroucke: Fermi LAT positron spectrum
Recently updated PAMELA electron + positron analysis e- spectrum positron fraction PRL 106, 201101 (May 20, 2011) Justin Vandenbroucke: Fermi LAT positron spectrum
PAMELA proton and alpha spectra Science 332 (6025): 69-72 (2011) protons alphas • ~E-2.7 power law • Proton flux an order of magnitude larger than alpha flux Justin Vandenbroucke: Fermi LAT positron spectrum
PAMELA antiproton fraction PRL 102, 051101 (2009) Consistent with diffuse model, unlike positron spectrum Justin Vandenbroucke: Fermi LAT positron spectrum
Fermi LAT orbits and exposure • Nearly uniform exposure every two orbits • Typical point on sky viewed for 30 minutes every 3 hours • Rocking: alternate North-pointing orbit with South-pointing orbit • This survey mode has been used exclusively except for an initial pointed-mode commissioning period and several pointed-mode observations of a few days each (Crab Nebula twice, Cyg X-3 once, and very bright blazar flare – 3C 454.3 – once) Atwood et al., ApJ 697, 1071 (2009) Justin Vandenbroucke: Fermi LAT positron spectrum
Fermi LAT data taking • Launched June 11, 2008 (3 years old!) • Normal data taking since August 4, 2008 • Data are publicly available, along with analysis software, from the Fermi Science Support Center (http://fermi.gsfc.nasa.gov/ssc) • 175 billion events at trigger level as of May 10, 2011 (~2 kHz) • 40 billion events sent from satellite to ground (after onboard filtering) • Photons available for download, few hours after being detected • As of May 2011, ~600 million photon events available, collected since August 4, 2008 • Detecting 6.3 gamma rays per second Justin Vandenbroucke: Fermi LAT positron spectrum
Separating electrons and positrons from gammas and protons • Anti-coincidence detector (ACD = set of scintillator tiles surrounding instrument) usually required to not fire, to reject charged particles and keep gamma rays • Here we require the ACD to fire, to select charged particles and reject the gamma ray “background” • Proton rejection: require broader, clumpier shower in CAL, TKR, and ACD: Increasing cut level and background rejection: required ~103 to 104 proton rejection achieved Justin Vandenbroucke: Fermi LAT positron spectrum
Hadron-lepton separation and data – Monte Carlo comparison after calorimeter cuts after tracker cuts after anti-coincidence cuts after classification tree cuts Justin Vandenbroucke: Fermi LAT positron spectrum
Acceptance and residual background contamination • Acceptance (“geometric factor) = 1-3 m2sr in 20 GeV to 1 TeV range • Residual hadron contamination = 5 to 20 % Justin Vandenbroucke: Fermi LAT positron spectrum
Low-energy and high-energy data streams • LE: “minimum bias” set, 1 of every 250 triggered events sent to ground • HE: any event that deposits ≥ 20 GeV in calorimeter sent to ground • Two parallel analyses for two streams, with good consistency in overlap region Justin Vandenbroucke: Fermi LAT positron spectrum
Energy resolution, measured with beam test: ~15% Justin Vandenbroucke: Fermi LAT positron spectrum
e+e- interpretation 1: conventional diffuse model • Black: electron + positron, blue: electron only • Dashed: without solar modulation Justin Vandenbroucke: Fermi LAT positron spectrum
e+e- interpretation 2: softer diffuse secondary model, plus additional source at high energy • Tuned to the data: softer diffuse injection spectrum, plus an additional component at high energy (pulsar? dark matter?) Justin Vandenbroucke: Fermi LAT positron spectrum
Search for anisotropy in cosmic ray electron + positron flux upper limits Ackermann et al, PRD 82, 092003 (2010) • 1.6 M candidate electrons above 60 GeV in first year • Entire sky searched for anisotropy with range of angular scales (10° to 90°) and energies • Dipole upper limits: 0.5% to 10% (comparable to expectation for single nearby source: models are not constrained) Justin Vandenbroucke: Fermi LAT positron spectrum
Cosmic ray electron/positron separation at ~ TeV with MAGIC and the Moon shadow? e+ shadow e- shadow MAGIC, arXiv:0907.1026 • Measure electrons/positrons using imaging atmospheric Cherenkov telescopes like HESS, but use the Moon shadow to separate electrons and positrons (two shadows separated by ~1° at ~1 TeV) • Moon phase must be < ~50% to avoid damaging PMTs • They have made observations and are analyzing Justin Vandenbroucke: Fermi LAT positron spectrum
Geomagnetic cutoff rigidities Below 20 GeV, we need to consider the shielding effect of the geo-magnetic field • Determine geomagnetic cutoff energy as a function of geomagnetic orbital coordinates (higher McIlwainL lower cutoff energy) • in each McIlwainL interval, measure spectrum for primary component above the cutoff, then recombine different spectra in the global spectrum • BONUS: this can be used to measure the absolute energy scale of the LAT Justin Vandenbroucke: Fermi LAT positron spectrum
Spectra: p+, e+e-, e+, p-bar From A. Strong cosmic ray database and M. Pesce-Rollins PhD thesis Justin Vandenbroucke: Fermi LAT positron spectrum
Proton flux 3-4 orders of magnitude larger than positron flux From A. Strong cosmic ray database and M. Pesce-Rollins PhD thesis Justin Vandenbroucke: Fermi LAT positron spectrum
Example interpretation with modified secondary production • Diffuse Galactic gammas pair produce on stellar photon field • Requires high starlight and gas densities • Both could be high near primary sources (e.g. SNRs) Stawarz et al., ApJ 710:236 (2010) Justin Vandenbroucke: Fermi LAT positron spectrum