Sustainable Fisheries Management and Conservation Practices
Explore the history of fisheries, management strategies, and ecological dynamics, including settlement patterns and habitat influences. Learn about fish stock assessments, fishing techniques, and theories on reef fish diversity.

Sustainable Fisheries Management and Conservation Practices
E N D
Presentation Transcript
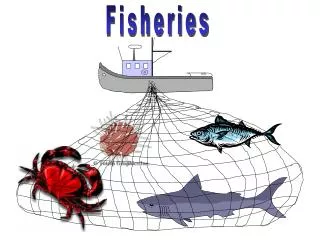
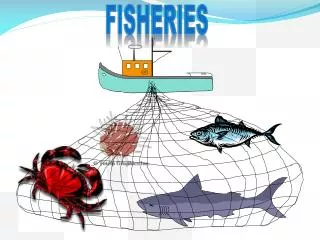
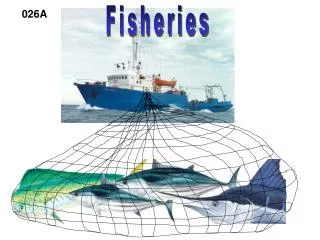
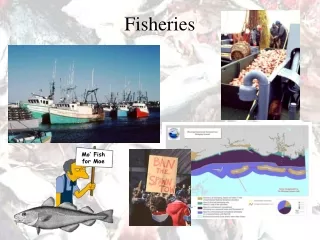
Fisheries Mo’ Fish for Moe
Fisheries “To hunt a species to extinction is not logical” – Mr. Spock Fish populations are renewable resources Overexploitation first occurred in shellfish beds and in estuaries Open-ocean fisheries were essentially limitless until the development of power-driven vessels and gear
Fisheries International shortages and disputes over fishing rights were solved the establishment of the Exclusive Economic Zone (EEZ), a 200-mile national fishing zone Actually led to overfishing by U.S. domestic fishing fleets
You Down With EEZ Law Of the Sea – established 200-mile-wide Exclusive Economic Zones (EEZ) – granting coastal nations exclusive rights with respect to natural resources
Fisheries Science Initiated in 1850”s by Norwegian government – hired scientists to determine why catches of cod fluctuated annually Stock – basic management units in fisheries because birth, growth, and death within the stock have greater effects on dynamics than immigration of emigration Size of a stock is mainly assessed by quality of landings function of: population size spatial variability of fish amount of fishing effort Health of a stock is assayed by its production, which is explained in terms of growth of previous year classes and recruitment into the new year class
Why study fisheries Despite collapse of individual fisheries and demise of high-seas fleets, new resources have been exploited and total landing have risen steadily since 1950 What does this trend represent? A better utilization of multiple resources or the “beginning of the end” in resource utilization
Phases of fisheries use Individuals can exploit fisheries at rates exceeding their capacity for replenishment – undergo phases of use
Fishing Techniques Purse seine Bottom trawl Gill net Longline
Settlement vs. Recruitment Settlement– larval transition from plankton to benthos Recruitment – Fisheries term; the point at which fish can be caught using standard gear Settlement numbers – the end result Final distribution depends on: - dispersal - predation and starvation (pre and post-settlement - settlement at the adult site - made some final movements toward the adult habitat - metamorphosed successfully - survived to be detected by the observer
Settlement Time to stop floating around Factors influencing settlement Light levels Physical aspects of substrate Chemical aspects of substrate (waterborne) Conspecifics Potential food Potential competitors (avoid sites with damselfish) Potential predators (if predator settles first->avoid)
Settlement Time to stop floating around Can reduced current flow affect larval settlement? Can seagrass density affect larval settlement? Slow Flow = Deposition Fast Flow = Resuspension
Can Habitat Affect Settlement High diversity High diversity in reefs systems Can habitat variety (complex 3-d systems) explain the diversity level? e.g., - Reefs = mix of coral, sand, caves, seagrass High degree of vertical zonation Many different available niches to occupy Numerous habitats not enough to explain diversity
4 theories to explain reef fish diversity & community structure The models: * 1. Lottery (chance) * 2. Recruitment limitation + 3. Predation-Disturbance + 4. Competition * Presettlement events + Post-settlement events
B B B C C A A A The Lottery Pelagic batch of larvae Supply of living sites on reef Disturbing factors space opens A A B Removing fishes C Change nature of site C Filled by random settlement Sites gained A
Recruitment Limitation Model e.g., - Victor, Doherty, Doherty and Williams Larval supply for total pop to reach K Changes in population structure reflect “input” Independent of post-settlement processes (competition) Nc Abundance Time S Result: community size unstable-> spp composition unstable
Juv Not always proportional Adult Recruitment Limitation e.g., - Doherty & Williams Evidence: Correlation between recruitment levels & long-term changes in adult abundance many times: no correlation!
Predation-Disturbance Model e.g., - Talbot et al., Jones, Hixon Predation (disturbance) after recruitment ->keeps pops below the level at which resources are limiting Naive recruits-> vulnerable Higher mortality early in life Type III curve Nc Abundance S Time
Type III Type II TypeI Survivorship Curves # of survivors Risk of mortality Type I – describes the situation in which mortality is concentrated toward the end of the maximum life span – e.g., - marine mammals, turtles Type III – indicates extensive early mortality, but a high rate of subsequent survival. This is typical of species that produce many offspring e.g., - teleost fishes Type II – describes a constant mortality rate from birth to maximum age - e.g., - sharks, rays
Determining post-settlement predation e.g., - Doherty & Sale Determine effect of predatory exclusion on survival 40% loss (predation) survivorship of reef fish recruits Predator removal: caging, spearfishing, poisons, trapping
Competition Model e.g., - Smith & Tyler, Jones Classic view: strong competitive interactions following recruitment lead to high degree of specialization Narrower ecological niches => so, more spp/area (“reduced niche breadth”) Support: competition inferred if (-) effect of density on 1) survival, 2) growth, 3) fecundity/maturation Evidence: Not conclusive
Post-recruitment (PR) competition Intense Weak Recruitment modified by PR processes Competition Model Predation Model Recruitment not modified by PR processes Lottery Model Recruitment limitation Model YN Space limited Summary: Community Models
Community Models Processes structuring communities-> not mutually exclusive All 4 affect population structure Need to consider pre- & post-recruitment processes R P,C Nc S
Lottery Model e.g., - Sale, Kaufman & Ebersole "I've never been so sure of anything in my life. I am going to WIN this lottery." – Homer Simpson Stochastic or random recruitment events Lottery for limited resource (space) Priority access: first one there wins No competitive advantages--Recruitment key! Result: community size stable-> species composition unstable
Factor Controlling Recruitment Recruitment – the number of individuals that reach a specified stage in the life cycle (e.g., - metamorphosis, settlement, joining the fishery) Factors influencing recruitment abundance and distribution of adult population number and viability of eggs produced survival of eggs and larvae
Factor Controlling Recruitment Over 99% mortality occurs between egg fertilization and settlement or recruitment of juveniles Important period – small variations in mortality rates have profound effects on subsequent abundance e.g., - higher fecundity is associated with greater recruitment variability Variable supply of recruits determines: population structure strength of interactions in multispecies communities biomass of fishes that can be caught Fisheries based upon one or two year classes are highly dependent upon successful recruitment Poor recruitment when fishing effort is very high may cause collapse
Mortality during early life history (ELH) Development – behavioral and physiological performance are key to survival and subsequent recruitment Growth - leads to changes in size or abundance of existing features Ontogeny - leads to the appearance of new features and reorganization or loss of existing ones metamorphosis – transformation from one body form (larval) to another (juvenile) endogenous – exogenous feeding – transition from yolk sac to external feeding “point of no return” – point at which larvae become too weak to feed and recover (starvation threshold) - resistance to starvation increases as larvae grow
Starvation and its effects upon recruitment Ocean stability hypothesis – aggregations of food, rather than total integrated food, were more important to larval survival e.g., - Hjort, Cushing, Lasker, Sinclair Patches of high food concentration as ocean stability Larvae in patches could feed effectively When ocean is rough, prey would become dispersed and density would become too low to support larvae
Starvation and its effects upon recruitment Match-mismatch hypothesis – interannual variation in larval survival could be explained by the match or mismatch between the timing of the production cycle and the peak of spawning time e.g., - Cushing, Mertz & Myers, Pope et al. If there is mismatch in space or time between larval food production and larval hatching time then the larvae may not encounter sufficient food and reach the “point of no return”
Starvation and its effects upon recruitment Member-vagrant hypothesis – importance of the relationship between spawning time and stable oceanographic features which retain larvae in favorable environments e.g., - Sinclair Emphasizes the role of physical rather than biological factors in governing spawning or year-class success Reality: - physical and biological processes will interact and both will be important
Starvation and its effects upon recruitment Bigger is better hypothesis – since mortality rates decline with size during ELH, it might be expected that getting big quickly will minimize mortality events e.g., - Houde High growth rates have costs that can lead to increased mortality, and actually growth rate evolved to balance the costs and benefits Reality: - Bigger may be better but is not necessarily the best strategy to get big quickly If it were, then natural selection would drive the genetic capacity for growth to the maximum permitted by physiological and phylogenetic constraints
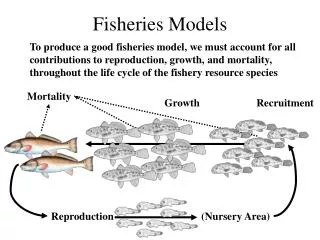
Fisheries Models To produce a good fisheries model, we must account for all contributions to reproduction, growth, and mortality, throughout the life cycle of the fishery resource species Mortality Growth Recruitment Reproduction (Nursery Area)
Population Biomass Fisheries Models Similarly, population biomass depends upon growth, reproduction, natural mortality, but also includes the implications of fishing mortality Reproduction Growth Models! Natural mortality Fishing mortality
Constructing Fisheries Models Initial goal to to determine maximum sustainable yield (MSY) Surplus population models – used to search for the largest fishing mortality rates that can be offset by increased population growth, normally measured in changes in population biomass per unit time Complex calculations based upon several life history parameters, including: population density population biomass population growth rate *Equilibrium – point at which processes balance one another *
Bmax MSY Bmax Bmax Oh, I forgot to er, carry the one “I first observed this technology at the airport gift shop” – Professor John Frink Logistic population growth Populations grow most quickly at intermediate sizes up to a maximum total biomass Bmax MSY in biomass occurs at a level of fishing mortality that places the population at an intermediate size
Applying Fisheries Models Since MSY is a small target (an actual number) and is also a moving target (due to temporal changes in productivity), actual catch controls are first gauged by simulations of high and low quotas. If quota set too high: yield would exceed the surplus population so the population would be driven to extinction If quota set too low: if the population is larger than BMSY – will stabilize and yield lower than BMSY if population is smaller than BMSY – will become unstable and either increase to equilibrium at the higher population size or crash
A Evaluating Fisheries Models The choice of production quotas is minor compared to the procedure of fitting these models to real data to estimate MSY and the level of fishing effort at which it occurs Several to choose from: e.g., - delay-difference, virtual population, statistical catch-at-age Yield-per-recruit models–seek fishing mortality rates that achieve the best tradeoff between the sizes of the individual caught, and the number of individuals available for capture The logic of yield-per-recruit models is based upon the trade-off between growth and mortality of individuals A = optimal age at which to catch fish
Y/R Overfishing! B/R Fishing mortality -F Fisheries Models in Action If fishing mortality rates are set too high, too many individuals will be taken before they have had a chance to grow – growth overfishing If fishing mortality is too low, although individuals will be large when captured, the total yield will be low Yield per recruit (Y/R) and population biomass per recruit (B/R) for a single cohort of fish, for various potential fishing mortalities, F
Fisheries Management Fisheries are managed because the consequences of uncontrolled fishing are undesirable e.g., - fishery collapse, economic inefficiency, loss of employment, habitat loss, decreases in abundance of rare species Primary goal – maintain maximum biologically sustainable yield (MSY or BSY) Recently a mixture of biological, economic, social, and political objectives
Multiplicity Current thinking: - concept of MSY may not be useful in fisheries management since overfishing has caused major alterations in the trophic structure of marine food webs Individual species do not live in a vacuum – they eat each other and may compete for food and space Biological interactions – mean that population dynamics of different species are inevitably linked
Bycatches and Discards "Do yourself a favor; don't turn around,“ – Keep America Beautiful Native American The aim of most fishers is to capture species that have financial or energetic value – target species Unfortunately, target species are often associated with other organisms that may not be the intended catch of that fishery – non-target species, which can become part of the catch known at incidental catch
Trawling effects It has been estimated that across fisheries worldwide, up to 1/4 of any given catch is bycatch Much higher in trawling operations; shrimp fisheries > 35% of global fisheries discards Kg discard per Kg landed Fishery Trinidadian shrimp trawl 14.70 GOM shrimp trawl 10.30 NW Atlantic fish trawl 5.30 Atlantic Menhaden purse seine 0.30 NW Atlantic Hake trawl 0.01 Case Study: GOM shrimp fisheries discarded 19 million red snapper and 3 million Spanish mackerel in 1989 (Alverson 1994)
What about the Wee Turtles? “If I don’t save the wee turtles, who will? Ah! Save me from the wee turtles. They were too quick for me. Ahh!” – Groundskeeper Wille For more than a quarter century, there has been concern about the impacts of shrimp trawling upon dwindling populations of endangered sea turtles. It is estimated that 150,000 sea turtles each year are killed in shrimp nets. Efforts by the United States to reduce sea turtle mortality by the required use of turtle excluder devices - TEDs - has resulted in a global environment-trade dispute now pending at the World Trade Organization
What about the Wee Turtles? A record 450 dead or disabled stranded sea turtles washed up on Texas beaches in 1999, 95 of them endangered Kemp's ridleys The Kemp's ridley, the most severely endangered sea turtle species, now numbers fewer than 2,000 females, down from over 40,000 recorded in 1947 Shrimping activity has increased 400% in Texas bays and 95% in adjacent gulf waters since 1961
World Production of Farmed Penaeid Shrimp 1000 800 600 Live weight (thousand tonnes) 400 Shrimp! 200 83 86 88 89 84 85 87 90 91 92 93 94 95 Year What’s the solution? “Well, that's why I asked. That's how you learn, by asking.. you dumbass.” - Carl Carlson Limited to a change in fisheries resources (stop eating shrimp) or a switch to another source of shrimp (aquaculture) Is aquaculture the solution? Disease outbreaks Environmental issues Habitat destruction Invasive species
Purse Seining Rate of incidentally caught dolphins in the Pacific tuna purse seine fishery in the 60’s and 70’s sparked the tuna-dolphin debate and the Marine Mammal Protection Act of 1972 However, 6 million dolphins killed since 1959 Three methods of purse seining for tuna in the eastern tropical Pacific On “Log” On “School” On “Dolphin ” # 16
Who’s Seining Who Although they are most detrimental to marine mammals, “Dolphin sets” overwhelmingly produces the least amount of bycatch and the greatest amount of large, adult tunas Between the 1950’s and 1970’s, 100% of purse seiners in the Eastern Tropical Pacific utilized Dolphin sets Since that time, effort placed upon moving the fishery towards Log and School sets 1993-1996 total data N= 10,000 sets per type
Hug This! "Yarr, it begins. The dolphins are upon us and only this old sea dog knows how to stop them -- Yarr!" - Captain McAllister The Problem:Log sets are easy to conduct, but produce incredibly high bycatch numbers (tens of millions) and generally yield young (5-15 lb) tuna School sets are difficult to conduct; require spotting schools independent of dolphin pods. Primarily utilizes juvenile tuna (10-25 lb) not yet associated with dolphins Dolphin sets – focus upon adult (>70 lb) fish with little associated bycatch numbers The Solution: Possible paradigm shift from the conservation of a single species toward the protection of entire ecosystems/trophic communities??? or More chicken contained in “Chicken of the Sea”
Fisheries Management – A Review Fisheries are managed because the consequences of uncontrolled fishing are undesirable However, we are still loosing species every year – moving towards smaller and “less desirable” species What effect will this have on marine/estuarine food chains? Over ½ of the world’s fisheries stocks are listed as either overfished or at capacity Primary goal – maintain maximum biologically sustainable yield (MSY or BSY) Difficult in a global community looking for heart healthy food products, cheap sources of protein, and the next delicacy Recently a mixture of biological, economic, social, and political objectives Shift from biological and social to political and economic?
Marine Protected Areas (MPAs) “Help! She’s touching my special area!” – Ralph Wiggum A Marine Protected Area is a geographic conservation unit designed to protect crucial communities and to provide reproductive reserves for fishes that hopefully will disperse into wider areas MPAs are based upon the concept of Metapopulation – a group of interconnected subpopulations, often of unequal size
Marine Protected Areas (MPAs) Establishment can be justified by 2 points: 1. Protection of areas crucial to the maintenance and even population expansion of fishery species 2. Protection of very diverse structural habitats, such as coral reefs, or other communities that are deemed by society to be of importance for economic, educational, or aesthetic reasons Source population – individuals from these populations move to other local populations by means of larval spread and adult dispersal and are aided by high reproduction Sink population – receive individuals dispersing from others, but do not provide dispersing individuals to other local populations