Download
1 / 27
270 likes | 407 Vues
Well Failure Probability. Risk of Cement/Casing Failure: Leaking Wells. A. R. Ingraffea , Ph.D., P.E. Dwight C. Baum Professor of Engineering Cornell University President: Physicians, Scientists, and Engineers for Healthy Energy, Inc.

E N D
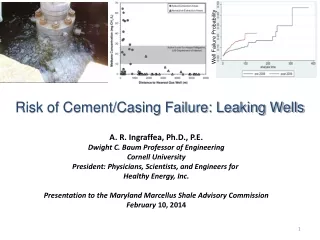
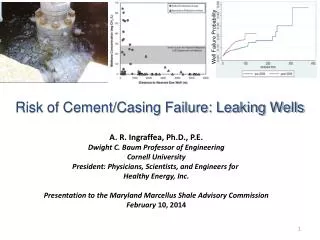
Well Failure Probability Risk of Cement/Casing Failure: Leaking Wells A. R. Ingraffea, Ph.D., P.E. Dwight C. Baum Professor of Engineering Cornell University President: Physicians, Scientists, and Engineers for Healthy Energy, Inc. Presentation to the Maryland Marcellus Shale Advisory Commission February 10, 2014
Words and Phrases that Describe “Leaking Wells” • Loss of structural integrity • Loss of wellbore integrity • Loss of zonal isolation • Barrier failure • Sustained casing pressure (SCP) • Sustained annular flow (SAF) • Sustained casing vent flow (SCVF) • Gas migration (GM)
What Is Concern About Cement/Casing Failure? • Cement/Casing failure can cause a gas/oil well to “leak” • A leaking gas/oil well may cause contamination of underground source of drinking water (USDW) and/or methane emissions to the atmosphere Absence of evidence of bubbling is not evidence of absence of leaking This could be result of cement failure, or casing failure. How common are such failures in the PA Marcellus?
Source of Methane Migration into Groundwater? Hundreds of Private Water Wells Contaminated in PA “There are at least three possible mechanisms for fluid migration into the shallow drinking-water aquifers that could help explain the increased methane concentrations we observed near gas wells…A second mechanism is leaky gas-well casings…Such leaks could occur at hundreds of meters underground, with methane passing laterally and vertically through fracture systems.” From Osborn et al. PNAS, 2011
Society of Petroleum Engineers Webinar on Wellbore Integrity Paul Hopman March 27, 2013
Industry-Reported Data On Loss of Wellbore Integrity: Offshore Wells SCP=Sustained Casing Pressure. Also called sustained annular pressure, in one or more of the casing annuli. • About 5% of wells fail soon • More fail with age • Most fail by maturity Brufatto et al., Oilfield Review, Schlumberger, Autumn, 2003
Industry-Reported Data On Loss of Wellbore Integrity: Onshore Wells SCVF = sustained casing vent flow GM = Gas migration Watson and Bachu, SPE 106817, 2009.
Leaky Well Industry Statistics From George E King Consulting Inc.: http://gekengineering.com/id6.html
What is the PA Marcellus Experience? • Created database of inspection and violation records for over 41,000 gas and oil wells drilled in Pennsylvania since 2000 • Mined the data to identify all wells with wellbore integrity problems • Statistically analyzed results: Cox Proportional Hazard Model to estimate future risk “Assessment and Risk Analysis of Casing and Cement Impairment in Oil and Gas Wells In Pennsylvania: 2000-2012.” Ingraffea et al. Paper currently under review.
The Well Database • The database is based on spud reports from the PADEP Office of Oil and Gas Management web page available to the public. • Conventional and unconventional gas, oil, combined gas and oil, and coalbed methane wells spudded from 01 Jan 2000 to 31 Dec 2012: 41,381 wells • All available compliance reports over the same time period. Reports provide data on inspection category (i.e. site, client, or facility), inspection type (e.g. administrative review, drilling, routine), inspection date, violations issued, and comments noted by the PADEP inspection staff regarding the inspection and/or violation(s) issued. • 8,703 wells show no public record of inspection; 5,223 wells with erroneous spud or inspection dates: all removed from further study • Resulting modeled statewide dataset contains 27,455 wells and 75,505 inspections.
What is the PA Marcellus Experience? • Created database of inspection and violation records for over 41,000 gas and oil wells drilled in Pennsylvania since 2000 • Mined the data to identify all wells with wellbore integrity problems • Statistically analyzed results: Cox Proportional Hazard Model to estimate future risk
Search Procedure for Structural Integrity Problem Indicators : Three Filters • Filter database for entries in “Violation Code” or “Violation Comment” fields in inspection reports • Filter both the “Inspection Comment” and “Violation Comment” fields for most common keywords associated with failure of primary cement/casing or common remediation measures • Keyword filter results then human-read thoroughly to confirm an indication of impaired well integrity
PA DEP Chapter 78 Violation Codes Used in 1st Filter (Source: PADEP (2013a))
What is the PA Marcellus Experience? • Created database of inspection and violation records for over 41,000 gas and oil wells drilled in Pennsylvania since 2000 • Mined the data to identify all wells with wellbore integrity problems • Statistically analyzed results: Cox Proportional Hazard Model to estimate future risk
Well Failure Rate Analysis • Cox Proportional Hazard Model to model well failure (hazard) rate • A multivariate regression technique to model the instantaneous risk of observing an event at time t given that an observed case has survived to time t, as a function of predictive covariates. • Well type (i.e. unconventional or conventional) and inspection counts (i.e. the number of times a well is inspected during the analysis time) are used as covariates . • Spud year cut-off (pre- and post-2009) and geographic (i.e. county) strata are run in separate analyses. • Inter-annual Wilcoxon statistics used to assess whether any groups of well spuds were statistically significantly different in terms of their predicted failure risk. • Risk of cement/casing problems for wells with incomplete inspection histories can be estimated from the behavior of wells with more complete histories.
Comparison of Hazard Estimates for Pre- and Post-2009 Spudded Wells: Statewide Data These plots predict, based on the cumulative histories of inspections and assuming that the risk of any one well is proportional to that in other wells, that at a given analysis time a well in a particular stratum has the indicated chance of exhibiting loss of zonal isolation. Fractional Probability of Loss of Zonal Isolation (weeks)
Comparison of Conventional and Unconventional Wells: Statewide, Pre-2009 Data Fractional Probability of Loss of Zonal Isolation (weeks)
Comparison of Conventional and Unconventional Wells: Statewide, Post-2009 Data Fractional Probability of Loss of Zonal Isolation Unconventional wells show a 58% (95%CI [47.3%, 67.2%]) higher risk of experiencing structural integrity issues relative to conventional wells (weeks)
Comparison of Northeast to Non-Northeast Counties: All Wells Bradford, Cameron, Clinton, Lycoming, Potter, Sullivan, Susquehanna, Tioga, Wayne, and Wyoming = Northeast Fractional Probability of Loss of Zonal Isolation (weeks)
Comparison of Conventional to Unconventional Wells: Northeast Counties Fractional Probability of Loss of Zonal Isolation (weeks)
Comparison of Northeast Counties, Pre- and Post-2009 Spuds Fractional Probability of Loss of Zonal Isolation (weeks)
Observations and Conclusions The Cox Proportional Hazard predictive process indicates that: • At least 13% of all Marcellus wells drilled statewide in PA since 2009 will experience loss of zonal isolation. • At least 45% of unconventional wells drilled in Northeast PA counties since 2009 will experience loss of zonal isolation. • Post-2009 unconventional wells in the Northeast PA counties will experience loss of zonal isolation at a higher rate than pre-2009 wells.
What Is Risk to Garrett/Allegany Counties? • Take 90%* of 1086 sq. mi.= 977 sq. mi. • Assume 8 wells/sq. mi. = 7,800 wells • Assume 10%** will leak within 5 years = 780 leaking wells • Impact on water wells? • Impact on GHG emissions? * Controlled by leasing, setbacks, zoning, etc. ** Conservative result from our risk assessment in PA Marcellus
What Is Risk to Garrett/Allegany Counties? Mitigation measures for impact on water wells • Fewer gas/oil wells permitted: residential, commercial, park zones? • Long setbacks from pads: 2,500 ft. in Dallas, TX • Frequent inspections, tough enforcements: water well contamination can happen quickly • More thorough inspection techniques: “bubbling” insufficient Mitigation measures for impact on GHG emissions • Frequent inspections, tough enforcements: life of well • More thorough inspection techniques: GM can occur away from wellhead