Download
1 / 42
430 likes | 586 Vues
Migration situation between Hungary and Ukraine. Áron Kincses Hungarian Central Statistical Office. Dr. Dávid Karácsonyi Geographical Research Institute of Hungarian Academy of Sciences. Migration Challenges to the Visegrad Countries from Eastern Europe Budapest, 19 October, 2009.

E N D
Migration situation between Hungaryand Ukraine Áron Kincses Hungarian Central Statistical Office Dr. Dávid Karácsonyi Geographical Research Institute of Hungarian Academy of Sciences Migration Challenges to the Visegrad Countries from Eastern Europe Budapest, 19 October, 2009
Historical overview of the Hungarian international migration statistics • During the years of isolation migration statistics did not exist at all. The situation changed fundamentally at the end of the 1980s when the political system changed. Hungary became a transit country to the west as well as a final destination for immigrants. • The need for a comprehensive and consolidated information system on migration was expressed at different levels of political and economic decision-making, public administration and civil society at the beginning of the 1990s. • The HCSO started to compile the international migration statistics with using the administrative data bases containing related information. • The first data was published in 1993.
Data sources of migration • The data base on migration dataset of Hungarian Central Statistical Office (HCSO), Office of Immigration and Nationality (Ministry of Interior) and Hungarian Tax and Financial Control Administration was used. • Foreigners meant a foreign citizen having a residence permit, an immigration permit or a settlement permit who stayed in Hungary on 1 January of the given year. • The migration processes have been examined by destination, place of origin, age-groups, educational attainments and share of taxpayer in this study. The studied spatial distribution level is NUTS3. We shall give more spatial distribution details where it is relevant. We could isolate three educational levels: a lower (ISCED 1-2), a middle (ISCED 3-4), and a higher (ISCED 5-7).
Migration in the World Stock of foreign and foreign-born population, 2006
Migration in the World Change inflows of migrants by county of origin, 1995-2005 and 2006 (as of % of total inflows) The share of total for top 10 country
Overview of the Hungarian international migration • International migration is of close concern to Hungary, where it has also had social, demographic and economic impacts. • The Hungarian pattern of age distribution, the activity rate, the employment rate, the number of tax-payers and the population number have been changed beneficially by migrants.
Hungarian population by citizens and age-groups, 1 January 2008
Foreign citizens in Hungary • Since the beginning of the 1990’s, there has been a positive balance in international migration in Hungary. Of the 174697 foreign people resident in Hungary on 1st January 2008 (1,7% of total population), 40% of them are Romanian, 10% of them are Ukrainian respectively Serbian citizens. Their share has increased, and their spatial concentration has decreased a bit in Hungary. So there are about17 000 Ukranian people residents in Hungary, and I have to make note of it, that since 1993, 10 299Ukranian people have similarly become Hungarian citizens (97% of them Hungarian-speaking). • The one of the most considerable group of foreign population is the Ukrainain citizens in Hungary. That’s why important to know what kind of features and spatial impacts characterize the international migration between these two neighbouring countries. We are going to examine the migration system from Ukraine to Hungary.
Foreign citizens residing in Hungary by country of citizenship
Ukrainian citizens in Hungary • As we can see, the effects of neighbouring countries are powerful and have gradually increased. The Ukranian – Hungarian migration relationships are traditionally strong. The most affected Hungarian settlements are Budapest (6243 person), Nyíregyháza (1010), Debrecen (579), Kisvárda (279) and Miskolc (210); and such counties are Budapest (6243), Szabolcs-Szatmár-Bereg (4179), Pest (2139) and Hajdú-Bihar (823), where more than 77% of migrants live.
Ukrainian migrants in Hungary by destination, 1 January 2001
Ukrainian migrants in Hungary by destination, 1 January 2008
How can we explain the Hungarian spatial contribution of Ukrainian citizens? • “There reason people move are no big mystery: they do it today, as they did two centuries ago to improve their lives.” written by Jeffrey G. Williamson (2005). • In my opinion besides the regional difference of earnings, the location has had an essential role on the spatial distribution of migrants. For someone it will play an important role in choosing a permanent address, location, central and peripheral territories. We should just think about the distance from the place of origin, or the ease of contact with family. So, according to our hypothesis there are two separate and considerable geographical motives. • The first is Budapest, the capital city of Hungary, which is a typical dynamic centre area of migration. A wide variety of occupations and counties of origin can be found there. • The second geographical motive is the proximity to the border, which is not a barrier, but rather a contact zone. • On the other hand, we can also observe accordingly reflected effect in the emigrant country, namely migrants from beside the border stay much closer to the border, than the others. The migrants from the inner counties of Ukraine may settle down in the centre of Hungary rather than in the periphery.
Spatial classification The aim of this study is to provide a relationship between original Ukrainian and current Hungarian counties. • According to dataset, we can divide the original counties into three classes. 1. Transcarpathian Plain 2. TranscarpathianMountains 3. Other counties. • On the other hand we also can divide the Hungarian counties into three groups by viewing the examined migration method. 1. Counties near to the border (Borsod-A-Z, Hajdú-B, Szabolcs-Sz-B) 2. The centres of immigration (Budapest and Pest county) 3.Other counties
Spatial distributions • It is important to note that between Transcarpathian Plan and CentralHungary there are strong migration flows (40% of all migrants). So this migration phenomenon is quite concentrated. Using the above classification,we can point out that Ukrainian people who now live near to the border, come in greatest number from proximity to border of Ukrainian side (86,6%). But most of the Ukrainian migrants, whose birthplace near to the border, have stayed in centre of Hungary (48,5%). Budapest and Pest County are chosen very likely by other immigrants independently of place of origin.
Results of classification Distribution of Ukrainian citizens residing in Hungary by classification of the original Ukrainian place, 1 January 2008 Distribution of Ukrainian citizens residing in Hungary by classification of the current Hungarian place, 1 January 2008
Detailed examinations-1 • This classification can be examined by educational attainmentand age-groups. We have carried out that highly educated have been attracted by the centre class of Hungary also from larger distance. • There are enourmos portion of people with higher education from the other classes of Ukrainian, who mostly stay in the centre class of Hungary. We confirmed, that the distribution of education attainment rather depends on the originUkrainian place of residence than on the original Hungarian one.
Ukrainian population in Hungary by education attainments and spatial classifications, 1 January 2008
Detailed examinations-2 • Very different spatial picture have been stated by age-classification. In the centre of Hungary most of Ukainian citizens are in working age. In contrast, we can highlight, that among Subcarpathian people vast percentage are in inactive age.
Ukrainian population in Hungary by age-groups and spatial classifications, 1 January 2008
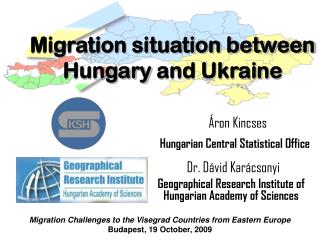
Demographical and migration situation in Ukraine Data source: Derzhkomstat, www.ukrstat.gov.ua, Author: Dávid Karácsonyi
Population rate by rayon (annual average) Data source: www.ukrcensus.gov.ua, Author: Dávid Karácsonyi
Population rate by rayon (annual average) Data source: www.ukrcensus.gov.ua, homepages of oblast statistical offices of Derzhkomstat Author: Dávid Karácsonyi
Natural population change by rayon (2004) (‰) Data source: Derzhkomstat oblast statistical yearbooks, 2004, Author: Dávid Karácsonyi
Migration balance by rayon (2004) (‰) Data source: Derzhkomstat oblast statistical yearbooks, 2004, Author: Dávid Karácsonyi
Migration situation types of rayons Data source: Derzhkomstat oblast statistical yearbooks, 2004 Author: Dávid Karácsonyi
Ageing Index 2001 (population older/younger than capable of work) (%) Data source: www.ukrcensus.gov.ua, Author: Dávid Karácsonyi
Denepndency Ratio 2001 (older+younger than capable of work / capable of work ) Data source: www.ukrcensus.gov.ua, Author: Dávid Karácsonyi
Components of population change (2003-2005) % Natural population change Interregional migration International migration Data source: Derzhkomstat, www.ukrstat.gov.ua, Author: Dávid Karácsonyi
Demographical situation in Transcarpatia (Zakarpattya) oblast Total population change 1989-2001 Map source: Károly Kocsis et al. 2006
Migration in Rayons of Zakarpattya oblast (2003-2005) Data source: Derzhkomstat oblast statistical yearbook of Zakarpattya oblast, 2003, 2004, 2005 Author: Dávid Karácsonyi
Ukrainian citizens staying in Hungary with settlement of origin in Zakarpattya oblast, 2001 Data source: BÁH, Hungarian Office for Imigration and Citizenship Author: Dávid Karácsonyi, Áron Kincses, Cartography: Zsolt Bottlik/MTA FKI
Ukrainian citizens staying in Hungary with settlement of origin in Zakarpattya oblast, 2008 Data source: BÁH, Hungarian Office for Imigration and Citizenship Author: Dávid Karácsonyi, Áron Kincses, Cartography: Zsolt Bottlik/MTA FKI
Ratio of ethnic Ukrainian population, 1989 Map source: Károly Kocsis et al. 2006
Ratio of ethnic Ukrainian population, 2001 Map source: Károly Kocsis et al. 2006
Ratio of ethnic Hungarian population, 1989 Map source: Károly Kocsis et al. 2006
Ratio of ethnic Hungarian population, 2001 Map source: Károly Kocsis et al. 2006
Change in the number of ethnic Hungarian population 1989-2001 Map source: Károly Kocsis et al. 2006
Applicants for Hungarian card, 2002-2004 Original Hungarian map source: www.geox.hu, Cartography: Dávid Karácsonyi
Thank you very much for your attention! Köszönjük a szíves figyelmüket! Большое спасибо за ваше внимание!